Copyright
©The Author(s) 2023.
World J Clin Cases. Mar 16, 2023; 11(8): 1814-1822
Published online Mar 16, 2023. doi: 10.12998/wjcc.v11.i8.1814
Published online Mar 16, 2023. doi: 10.12998/wjcc.v11.i8.1814
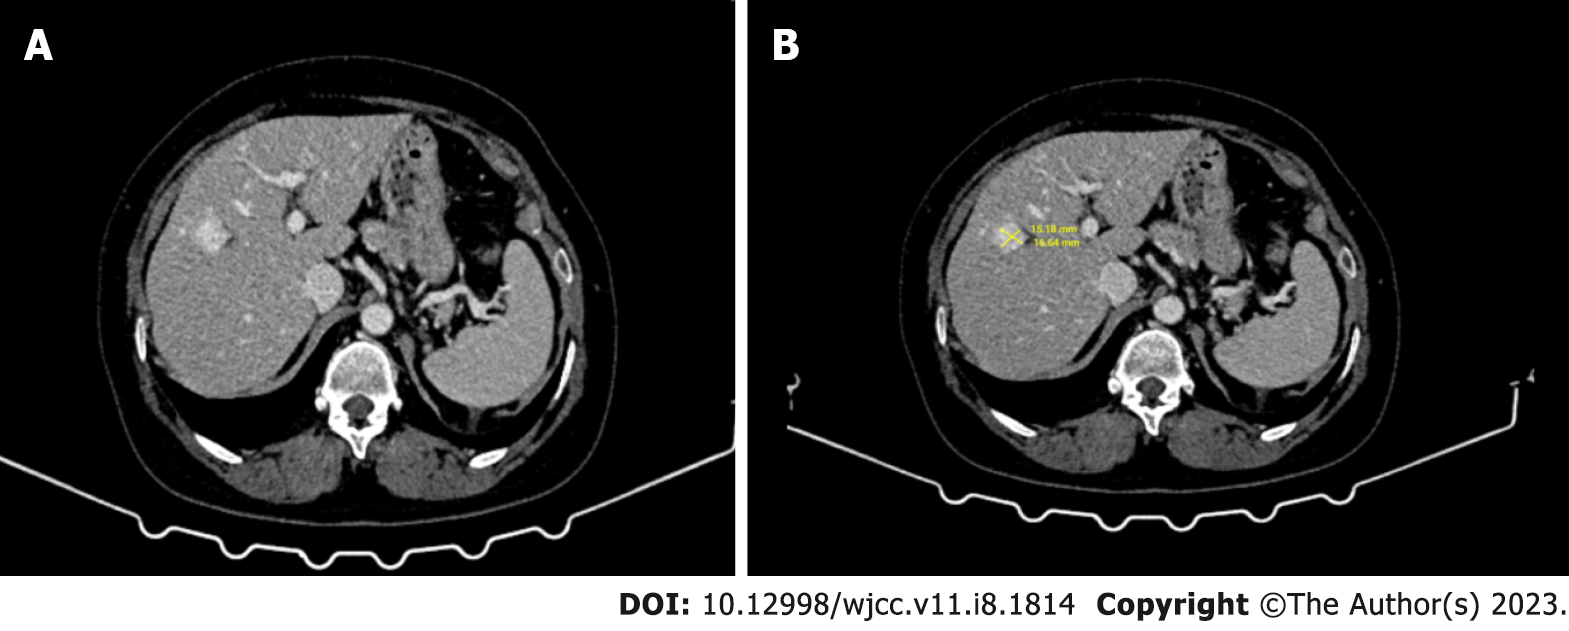
Figure 1 Computed tomography.
A and B: Contrast-enhanced computed tomography, in the venous phase, a 15 mm × 16 mm hyperdense tumor was observed in liver segment 4 with blurred contours in places.
Figure 2 Magnetic resonance imaging.
A-C: In magnetic resonance imaging (MRI), the in-phase (A) and out-phase (B) images of the liver segment 4 obtained by the “Dual echo” method of the tumor with faint contours; no significant signal loss was observed when both sequences were compared. In the fat-suppressed T2-weighted MRI image (C), no significant signal loss was also present (findings to indicate absence of fatty content).
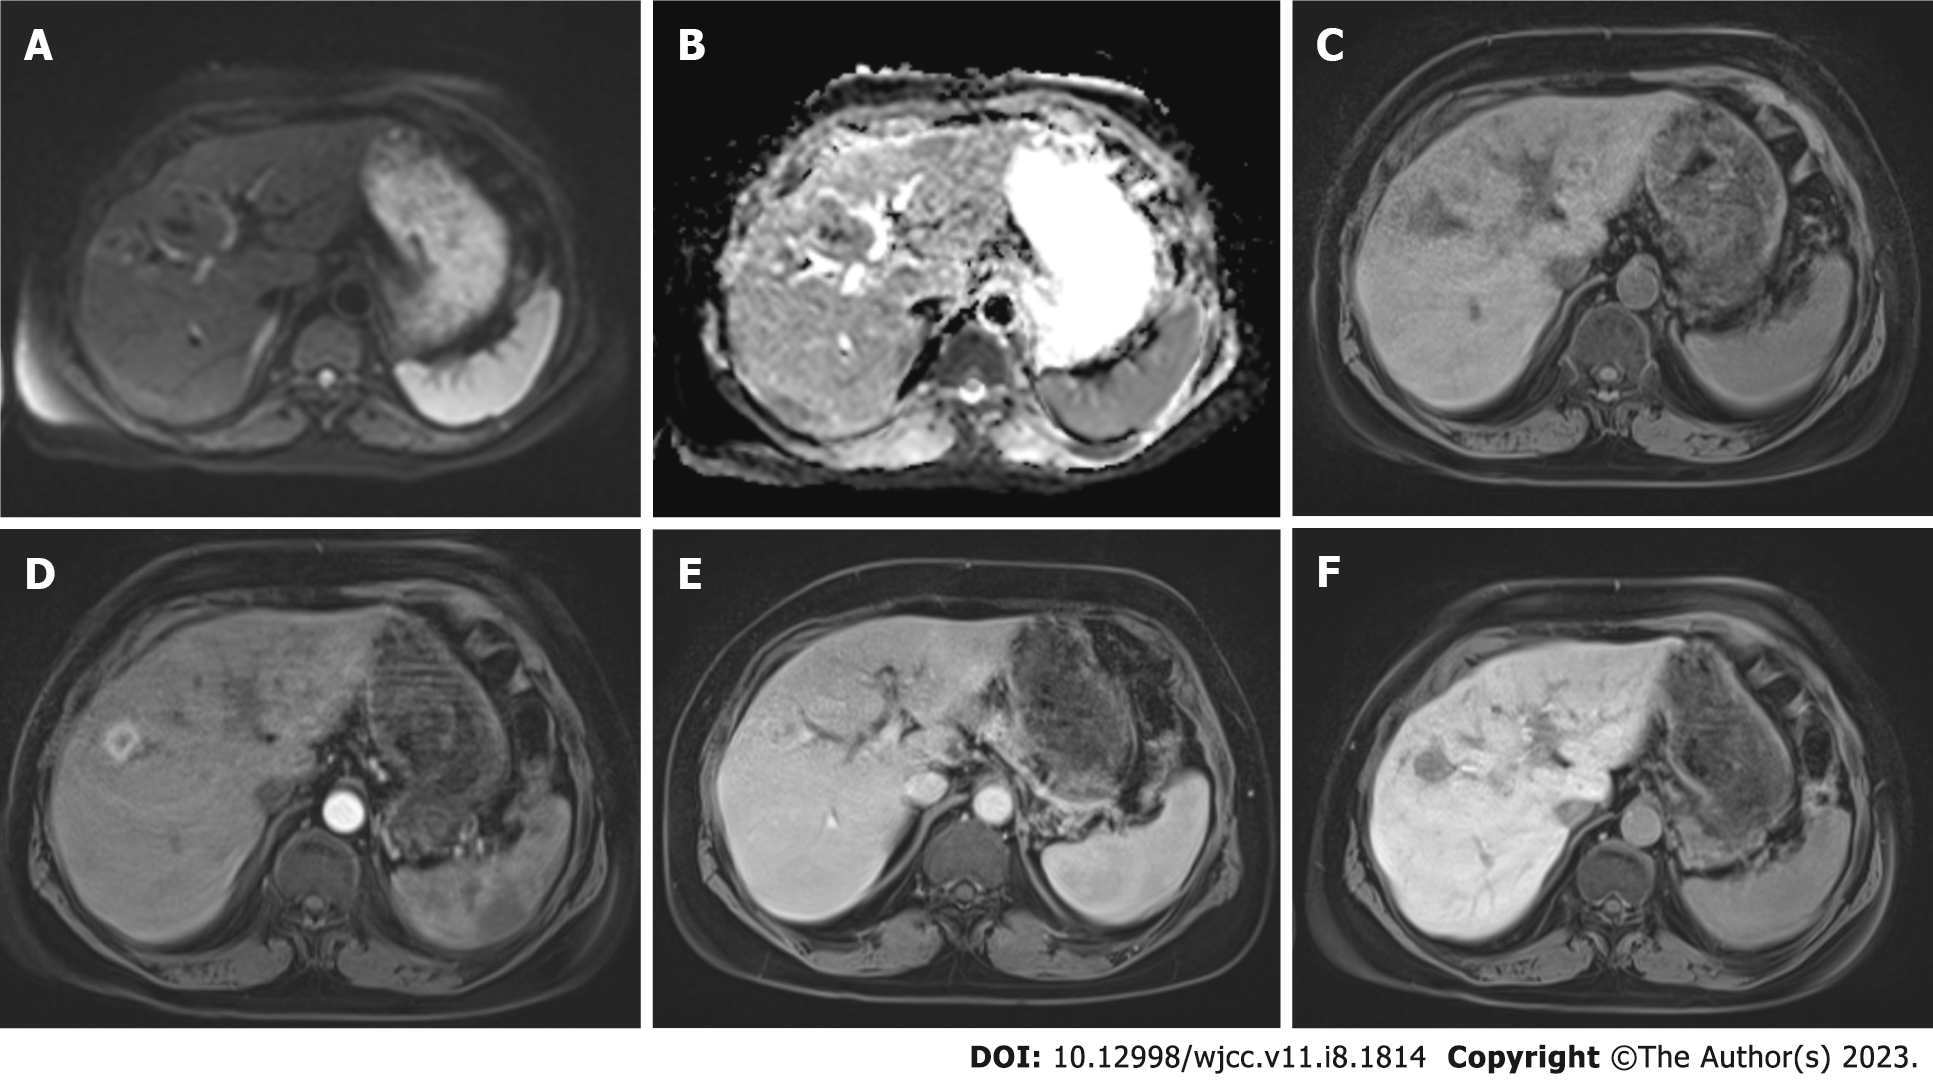
Figure 3 A 16 mm diameter lesion located at the segment 4.
A and B: The lesion has mild diffusion restriction on diffusion-weighted images and apparent diffusion coefficient maps; C: It is hypointense in the precontrast phase; D: It showes strongperipheral enhancement in the arterial phase; E: Continues toenhance in venous phase; F: The lesion is seen relatively hypointense in the hepatobiliary phase images (20th min). The diagnosis was confirmed by pathology as fat-poor angiomyolipoma.
- Citation: Gulmez AO, Aydin S, Kantarci M. A complementary comment on primary hepatic angiosarcoma: A case report. World J Clin Cases 2023; 11(8): 1814-1822
- URL: https://www.wjgnet.com/2307-8960/full/v11/i8/1814.htm
- DOI: https://dx.doi.org/10.12998/wjcc.v11.i8.1814


