Copyright
©The Author(s) 2023.
World J Clin Cases. Jul 26, 2023; 11(21): 5083-5096
Published online Jul 26, 2023. doi: 10.12998/wjcc.v11.i21.5083
Published online Jul 26, 2023. doi: 10.12998/wjcc.v11.i21.5083
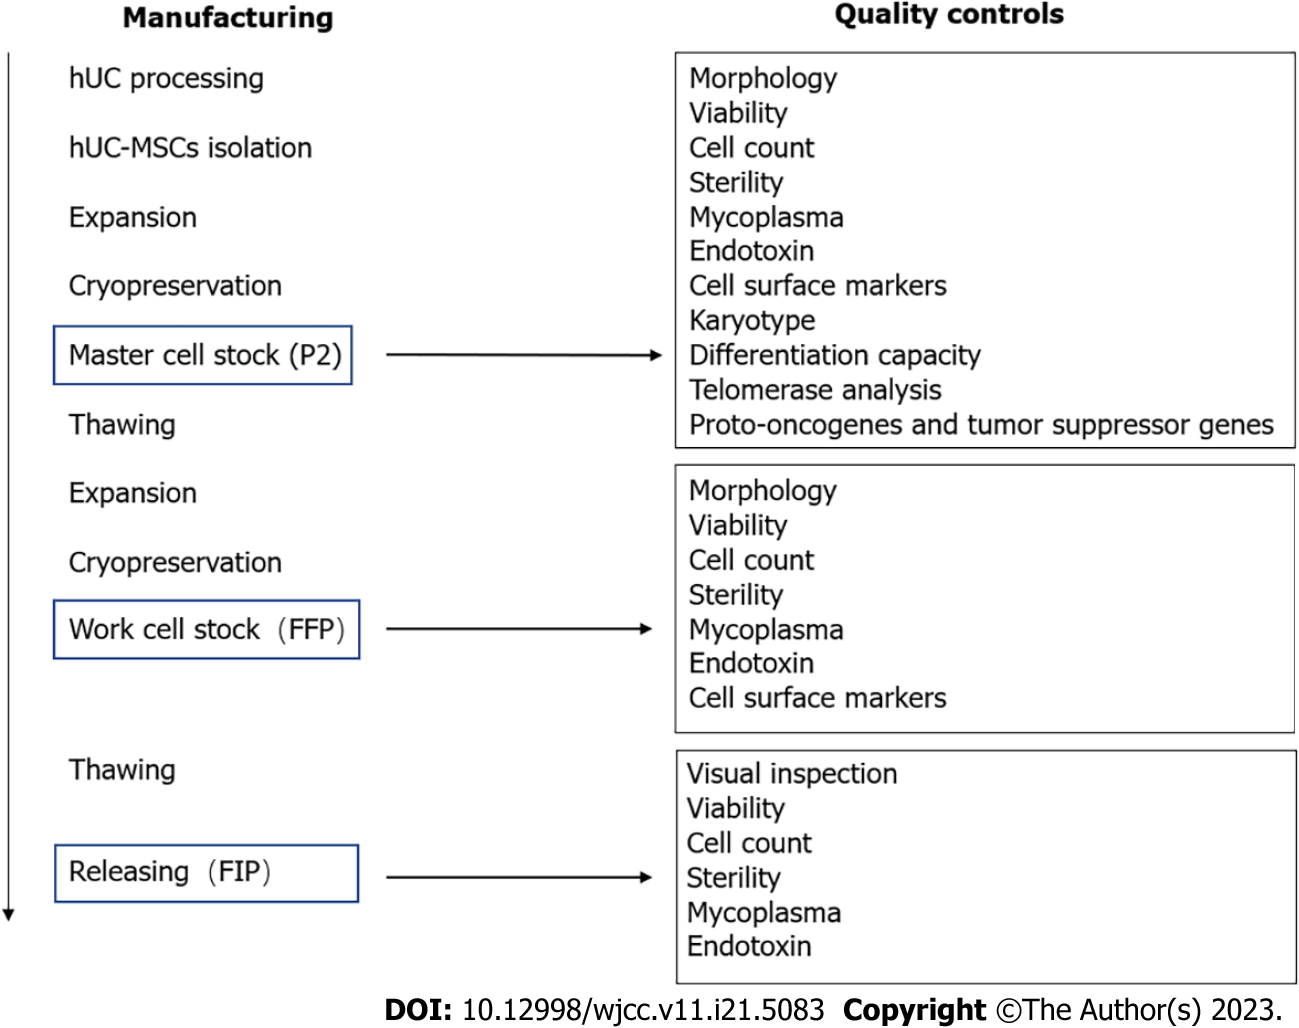
Figure 1 Stem cell manufacturing and quality control processes.
FFP: Final frozen product; FIP: Final infusion product; hUC: Human umbilical cord; MSCs: Mesenchymal stem cells; P2: Second passage.
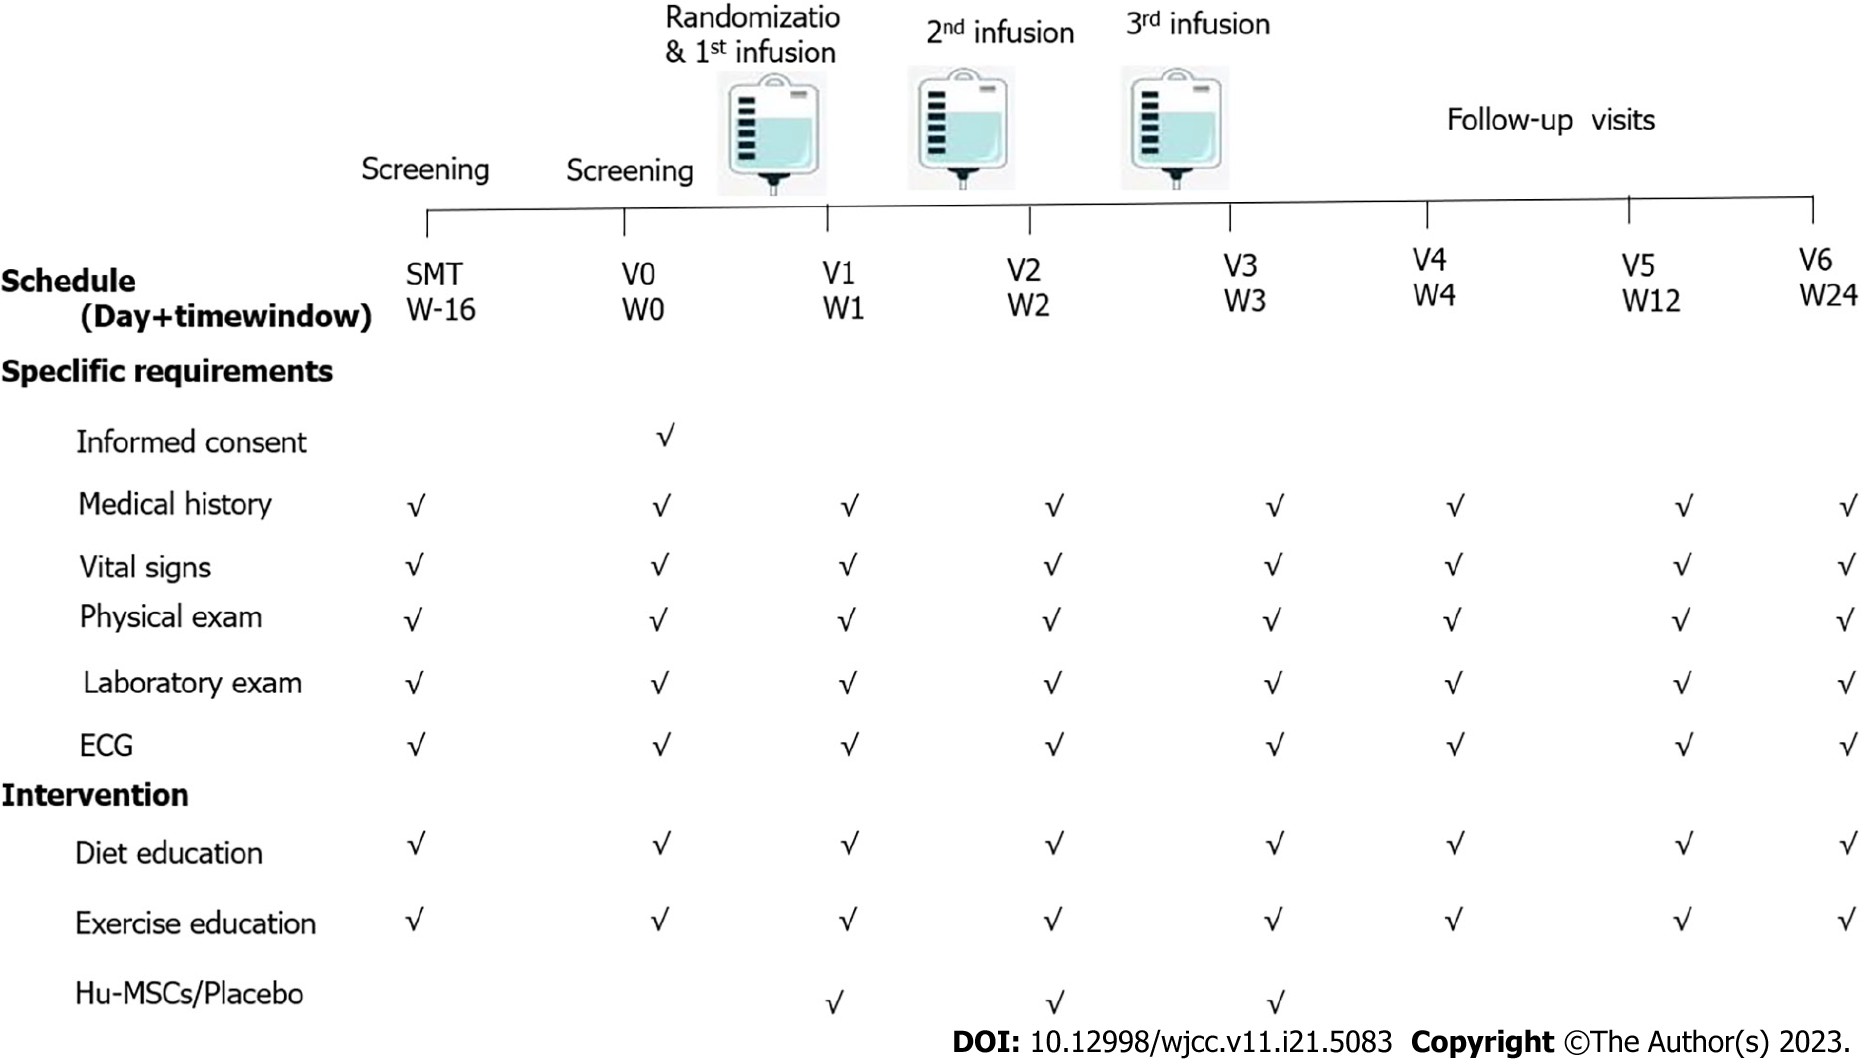
Figure 2 Flow chart of the study procedure.
The patients enrolled in the present study received three infusions on days 7, 14, and 21. They participated in four visits, occurring on days 0, 28, 84, and 180. ECG: Electrocardiogram; Hu-MSCs: Human umbilical cord-mesenchymal stem cells.
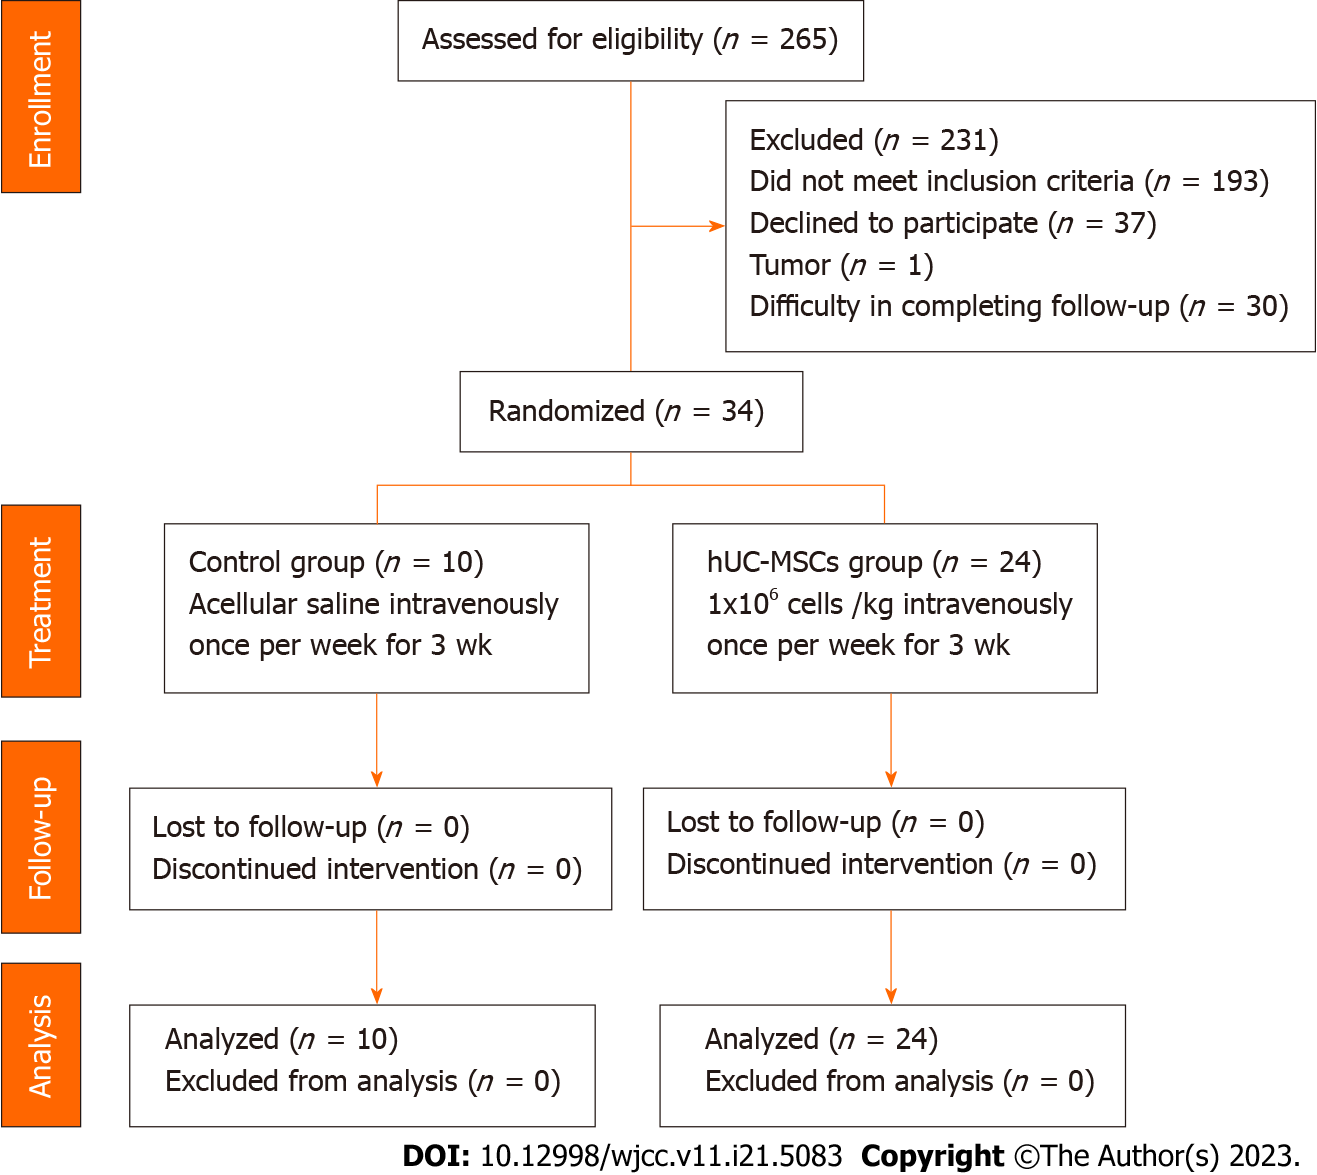
Figure 3 Flow diagram for patient recruitment.
Thirty-four patients were enrolled and completed the entire study procedure. No enrolled patient was excluded from the safety analysis. hUC-MSCs: Human umbilical cord-mesenchymal stem cells.
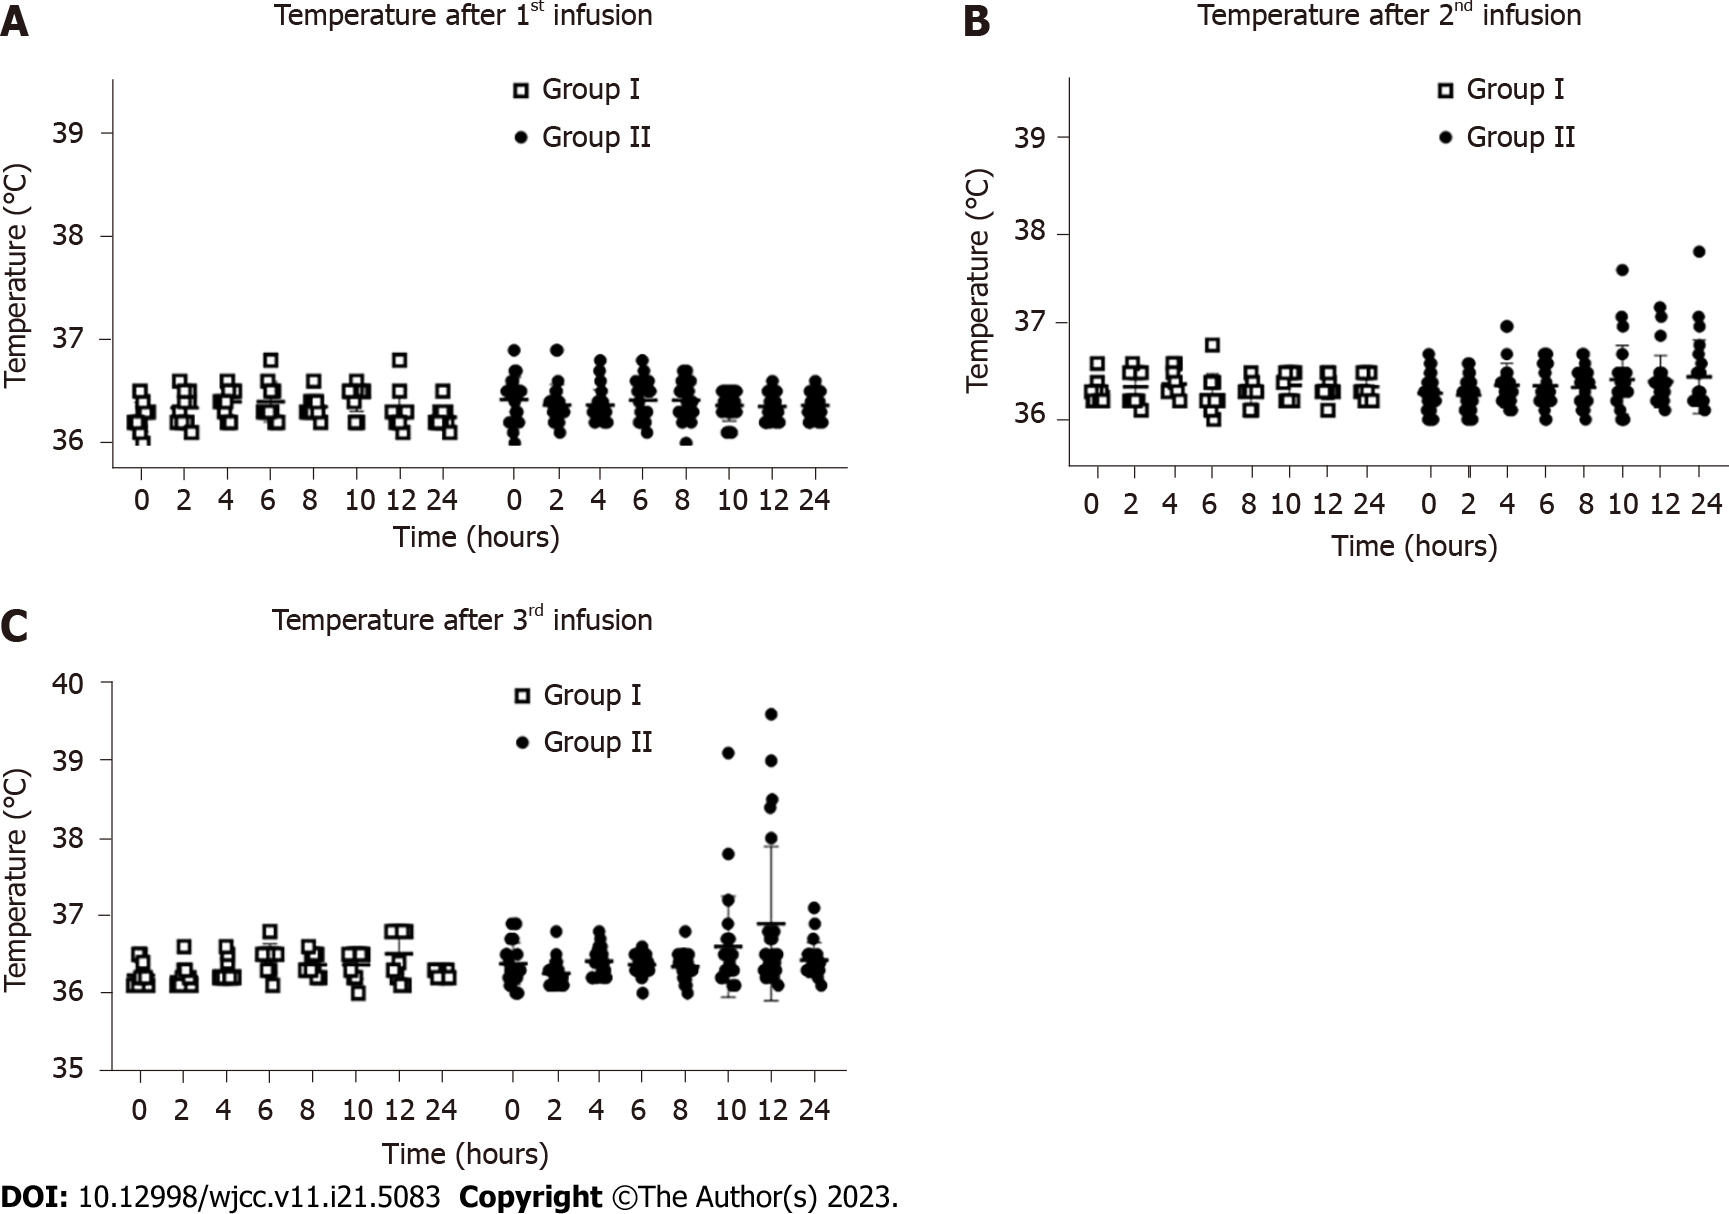
Figure 4 Fever occurrence within 24 h after infusion.
A: Temperatures of the patients within 24 h after the first infusion; B: Temperatures of the patients within 24 h after the second infusion; C: Temperatures of the patients within 24 h after the third infusion. Group I: Placebo group; Group II: Human umbilical cord-mesenchymal stem cell infusion group.
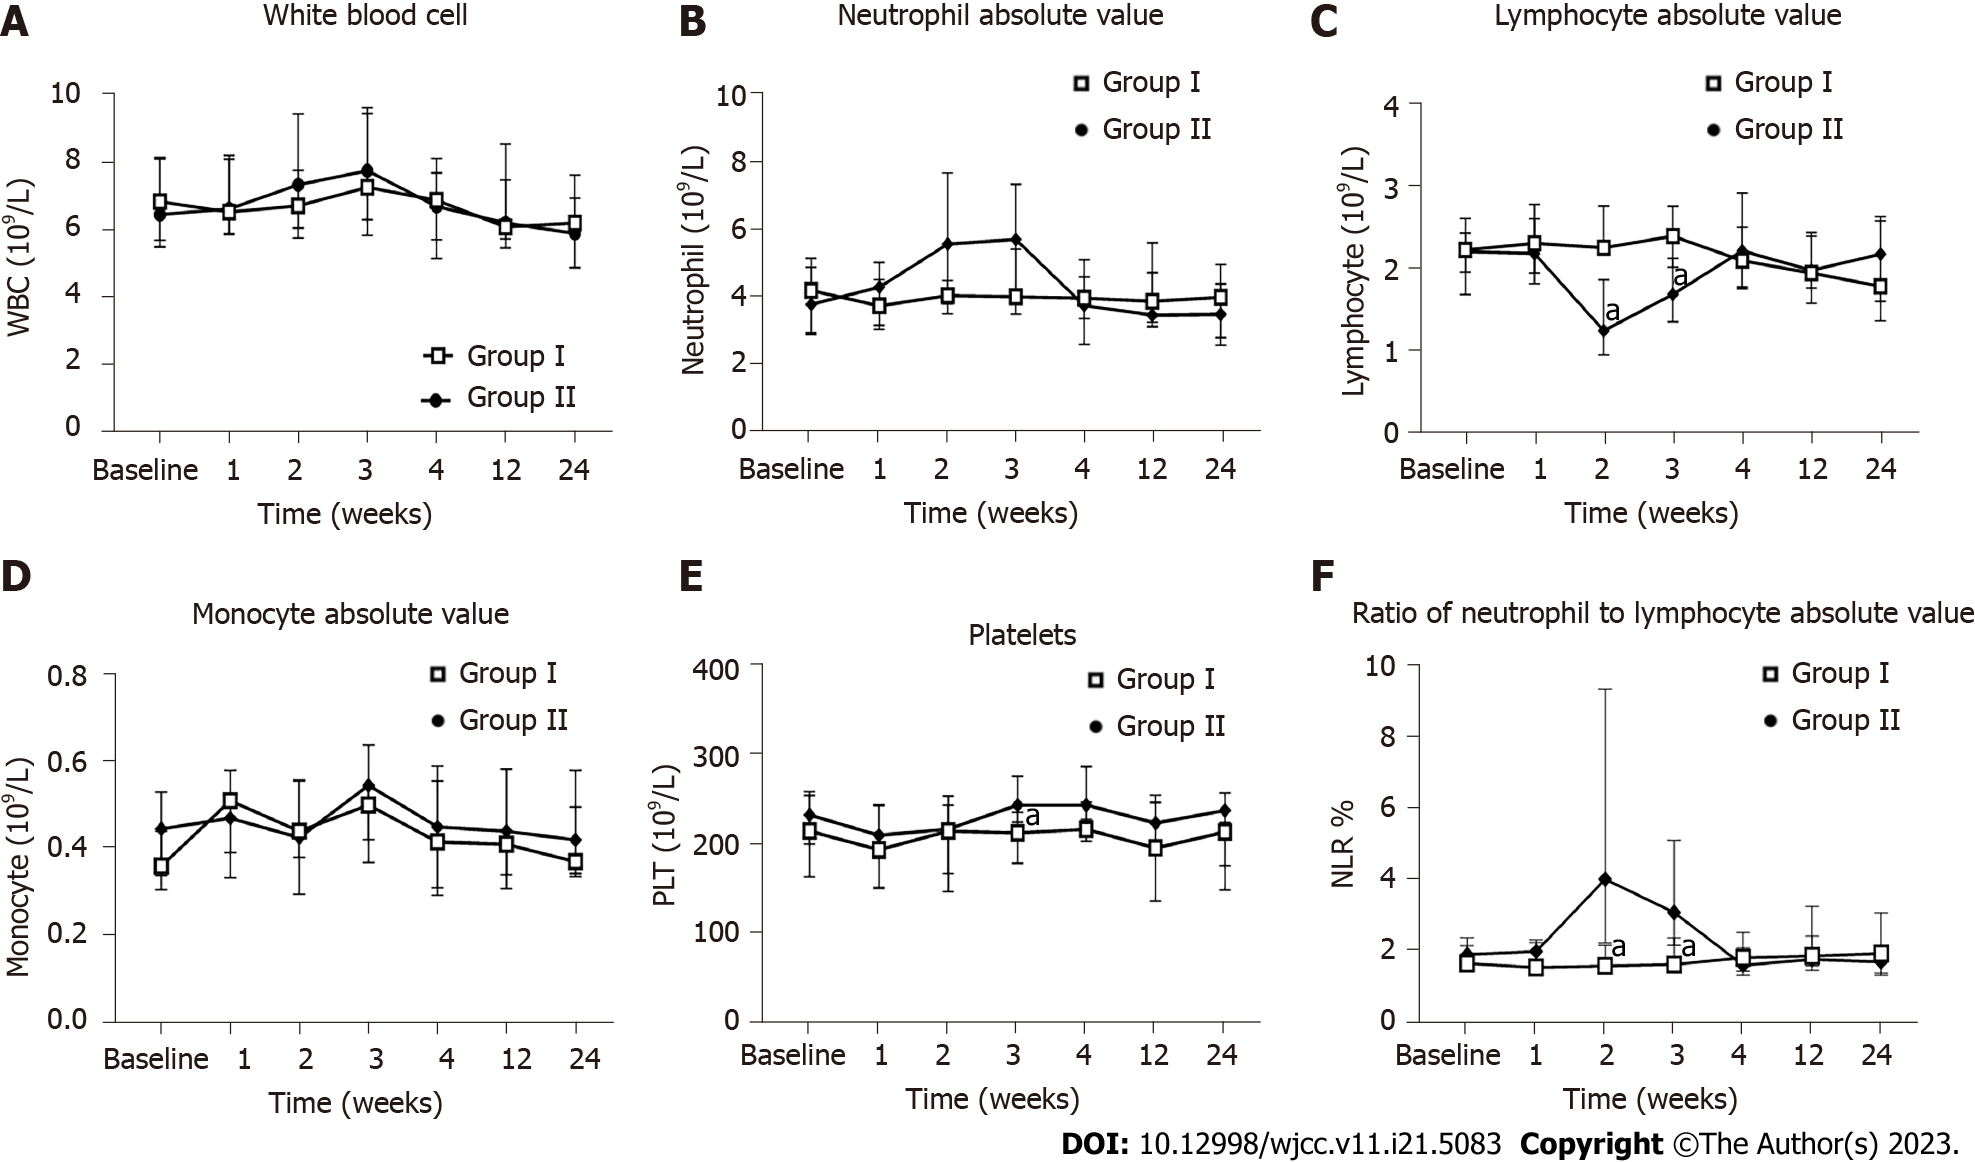
Figure 5 Influence of the human umbilical cord-mesenchymal stem cell treatment on routine blood measurements.
Measurements for all indicators were taken at baseline and weeks 1, 2, 3, 4, 12, and 24 after the first infusion. A: White blood cell count; B: Neutrophil absolute value; C: Lymphocyte absolute value; D: Monocyte absolute value, E: Platelet level; F: Neutrophil-to-lymphocyte ratio. aP < 0.05. Group I: Placebo group; Group II: Human umbilical cord-mesenchymal stem cell infusion group; WBC: White blood cell; PLT: Platelet; NLR: Neutrophil-to-lymphocyte ratio.
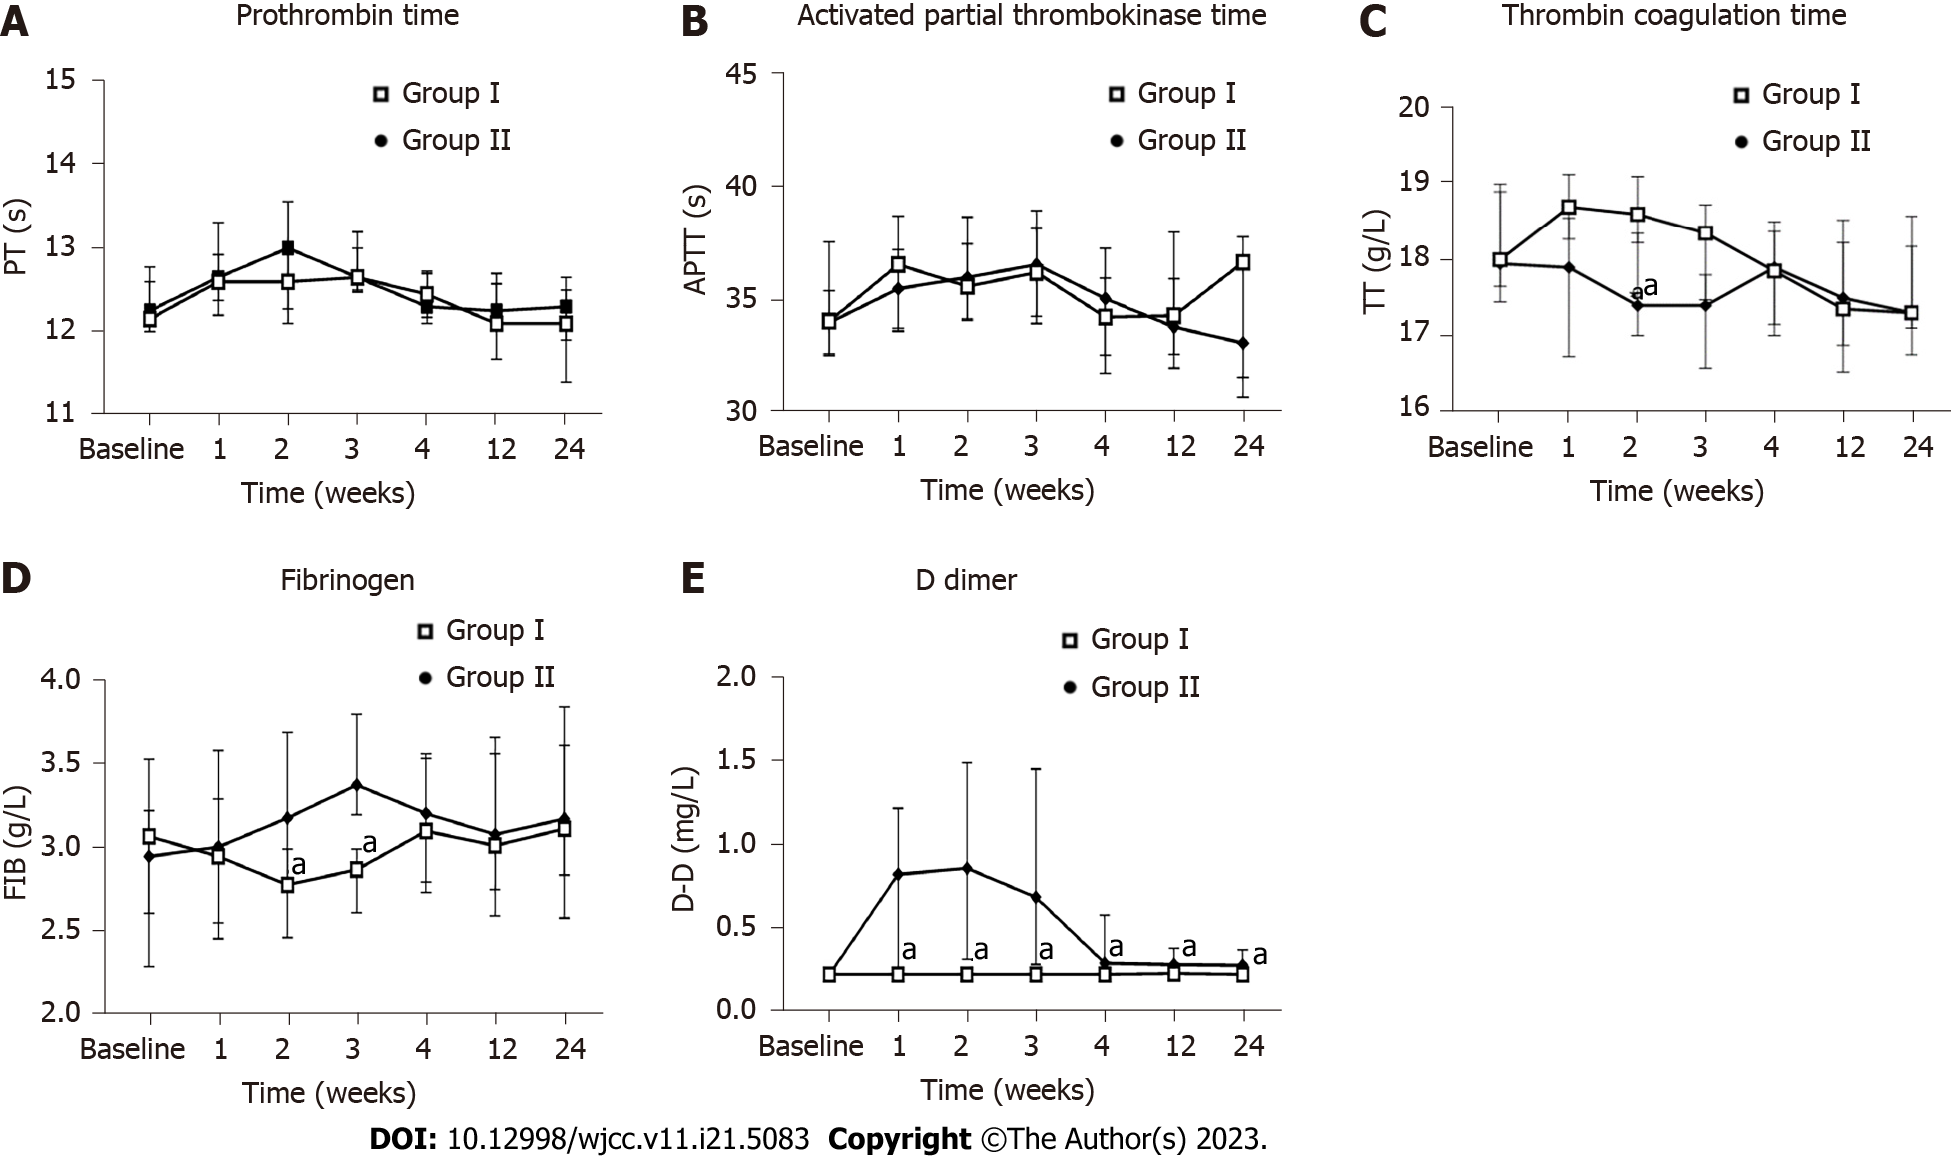
Figure 6 Influence of human umbilical cord-mesenchymal stem cell treatment on coagulation function.
Measurements for all indicators were taken at baseline and weeks 1, 2, 3, 4, 12, and 24 after the first infusion. A: Prothrombin time; B: Activated partial thrombokinase time; C: Thrombin coagulation time; D: Fibrinogen; E: D-dimer. aP < 0.05. Group I: Placebo group; Group II: Human umbilical cord-mesenchymal stem cell infusion group; PT: Prothrombin time; APTT: Activated partial thrombokinase time; TT: Thrombin coagulation time; FIB: Fibrinogen; D-D: D-dimer.
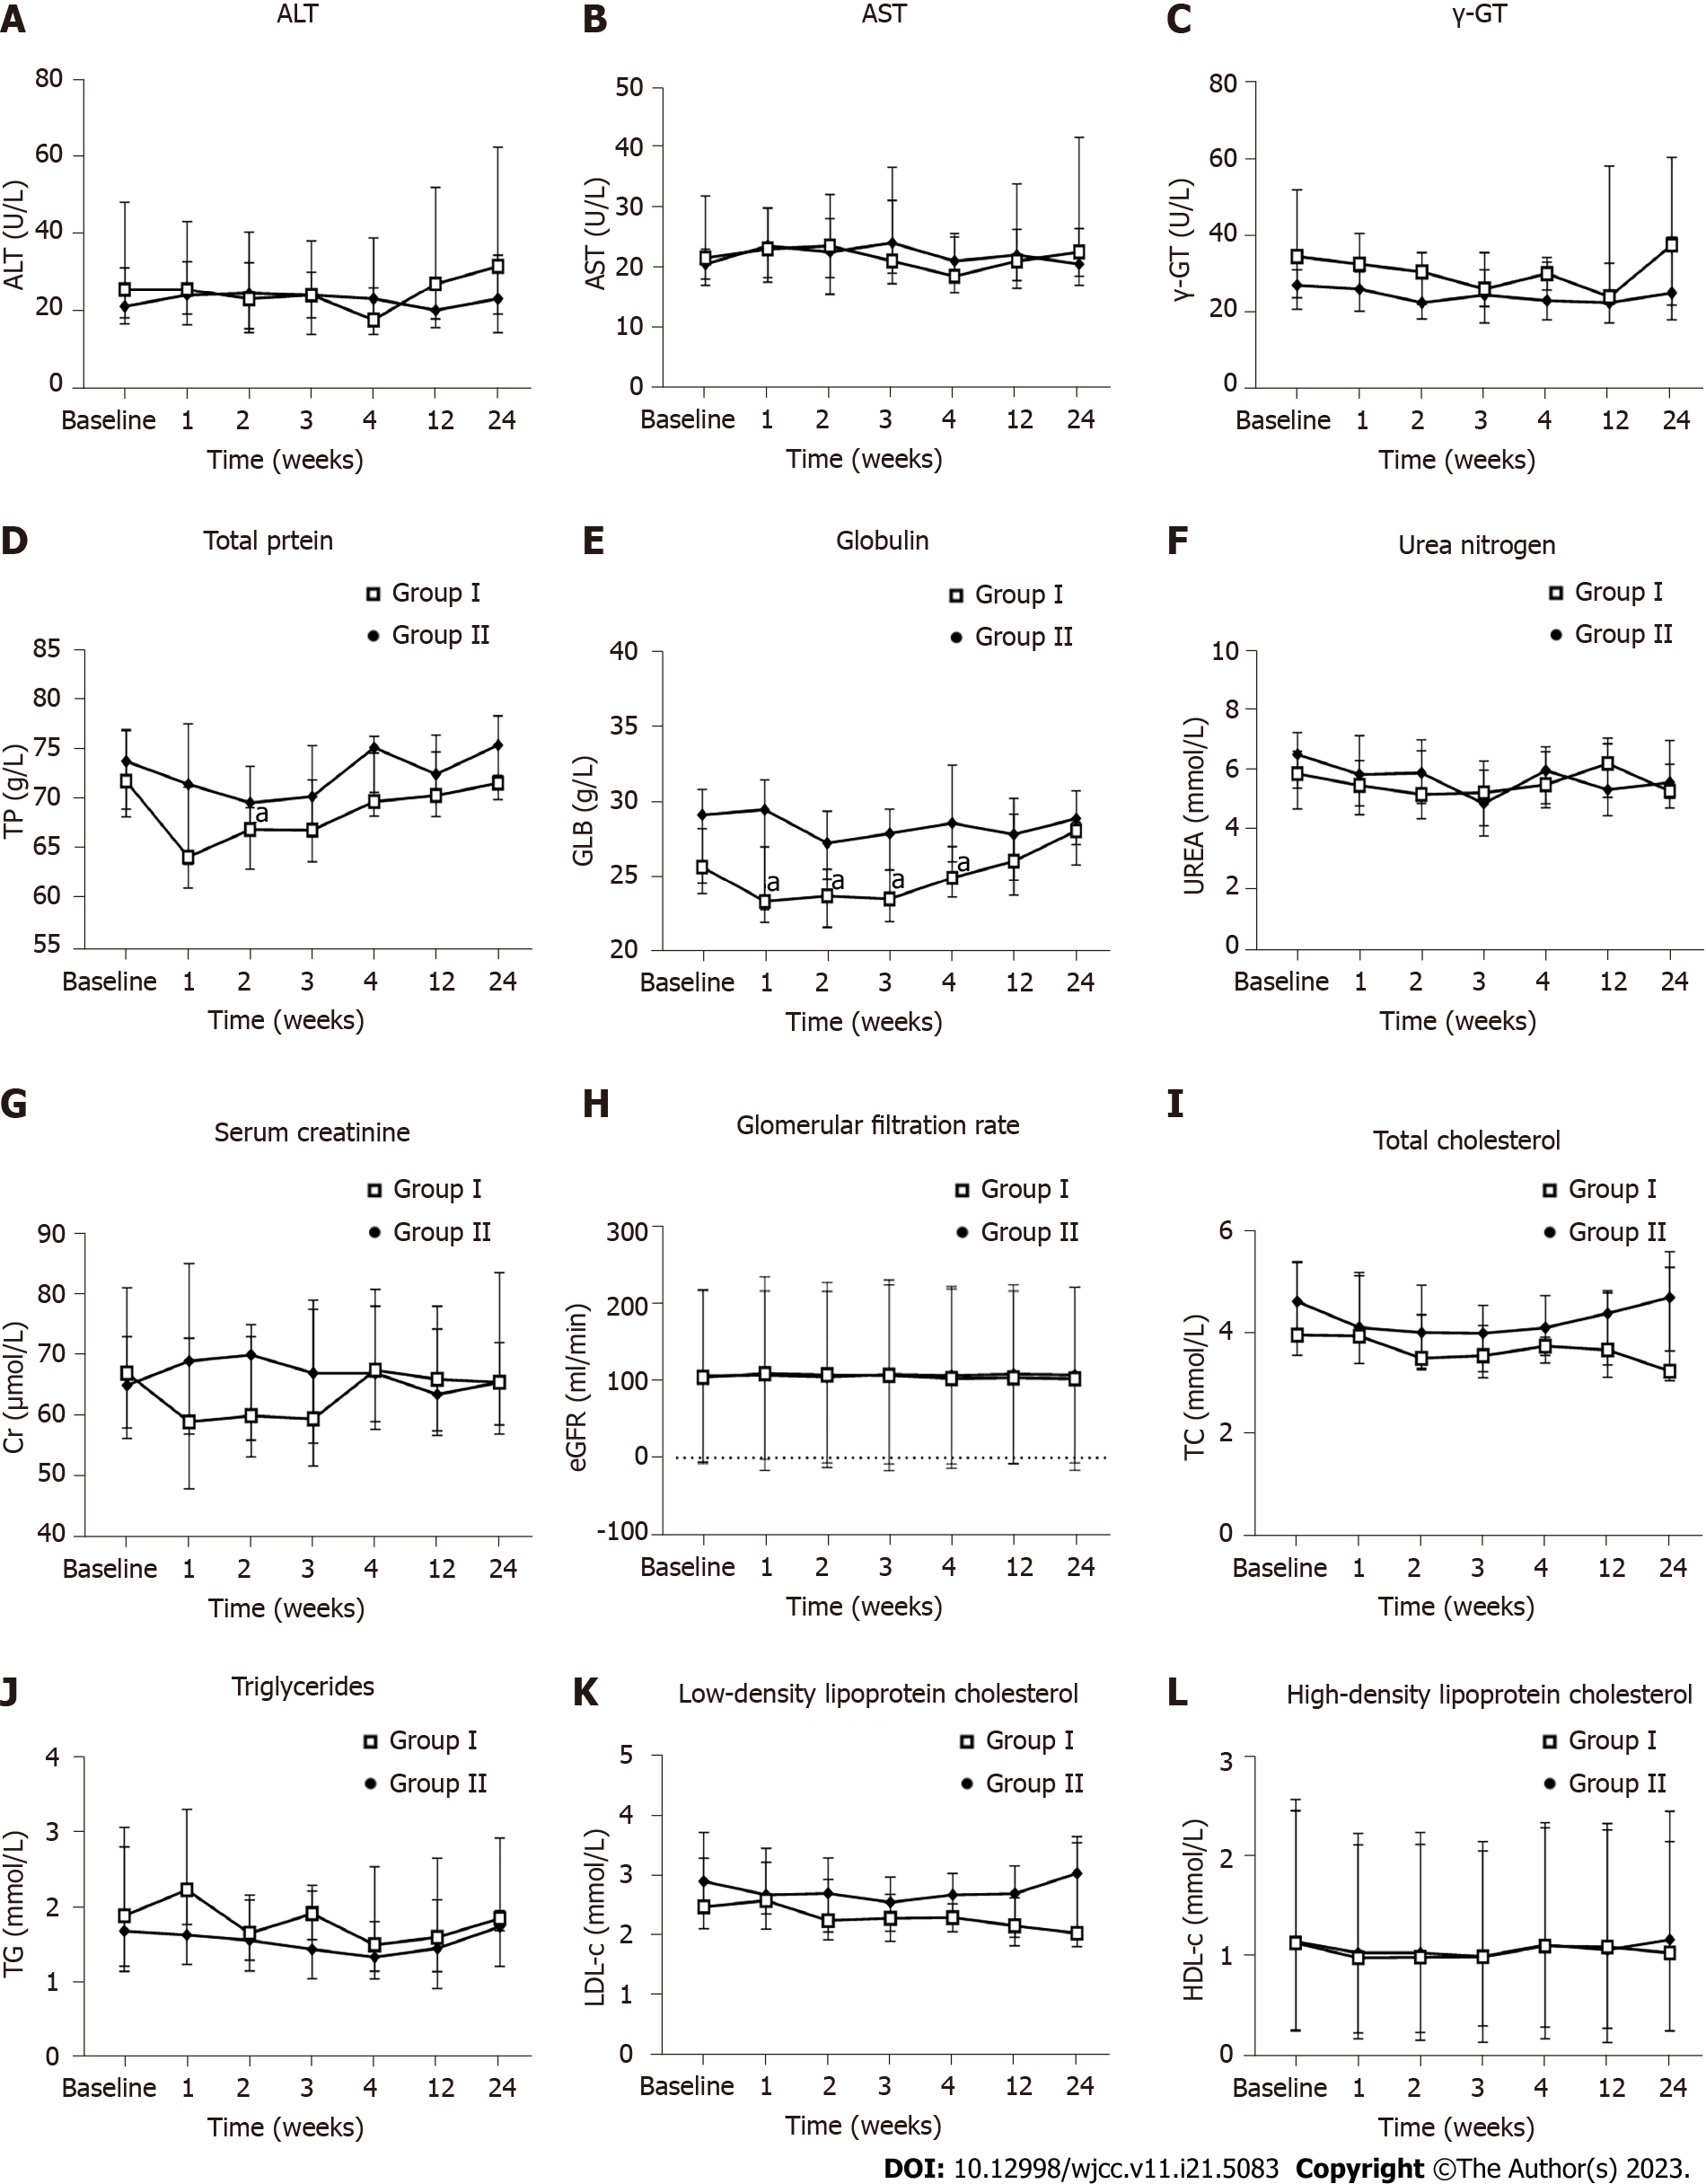
Figure 7 Influence of the human umbilical cord-mesenchymal stem cell treatment on liver function, renal function, and blood lipids.
Measurements for all indicators were taken at baseline and weeks 1, 2, 3, 4, 12, and 24 after the first infusion. A: Alanine transaminase; B: Aspartate transaminase; C: Gamma-glutamyl transferase; D: Total protein; E: Immunoglobulin; F: Urea nitrogen; G: Serum creatinine; H: Estimated glomerular filtration rate; I: Total cholesterol; J: Triglycerides; K: Low-density lipoprotein cholesterol; L: High-density lipoprotein cholesterol. aP < 0.05. Group I: Placebo group; Group II: Human umbilical cord-mesenchymal stem cell infusion group; ALT: Alanine transaminase; AST: Aspartate transaminase; γ-GT: Gamma-glutamyl transferase; TP: Total protein; GLB: Immunoglobulin; UREA: Urea nitrogen; Cr: Serum creatinine; eGFR: Estimated glomerular filtration rate; TC: Total cholesterol; TG: Triglycerides; LDL-C: Low-density lipoprotein cholesterol; HDL-C: High-density lipoprotein cholesterol.
Figure 8 Influence of the human umbilical cord-mesenchymal stem cell treatment on tumor markers.
Measurements for all indicators were taken at baseline and weeks 4, 12, and 24 after the first infusion. A: Alpha-fetoprotein; B: Carcinoembryonic antigen; C: Carbohydrate antigen 199. Group I: Placebo group; Group II: Human umbilical cord-mesenchymal stem cell infusion group; AFP: Alpha-fetoprotein; CEA: Carcinoembryonic antigen; CA199: Carbohydrate antigen 199.
- Citation: Lian XF, Lu DH, Liu HL, Liu YJ, Yang Y, Lin Y, Xie F, Huang CH, Wu HM, Long AM, Hui CJ, Shi Y, Chen Y, Gao YF, Zhang F. Safety evaluation of human umbilical cord-mesenchymal stem cells in type 2 diabetes mellitus treatment: A phase 2 clinical trial. World J Clin Cases 2023; 11(21): 5083-5096
- URL: https://www.wjgnet.com/2307-8960/full/v11/i21/5083.htm
- DOI: https://dx.doi.org/10.12998/wjcc.v11.i21.5083


