Copyright
©The Author(s) 2023.
World J Clin Cases. Jan 6, 2023; 11(1): 242-248
Published online Jan 6, 2023. doi: 10.12998/wjcc.v11.i1.242
Published online Jan 6, 2023. doi: 10.12998/wjcc.v11.i1.242
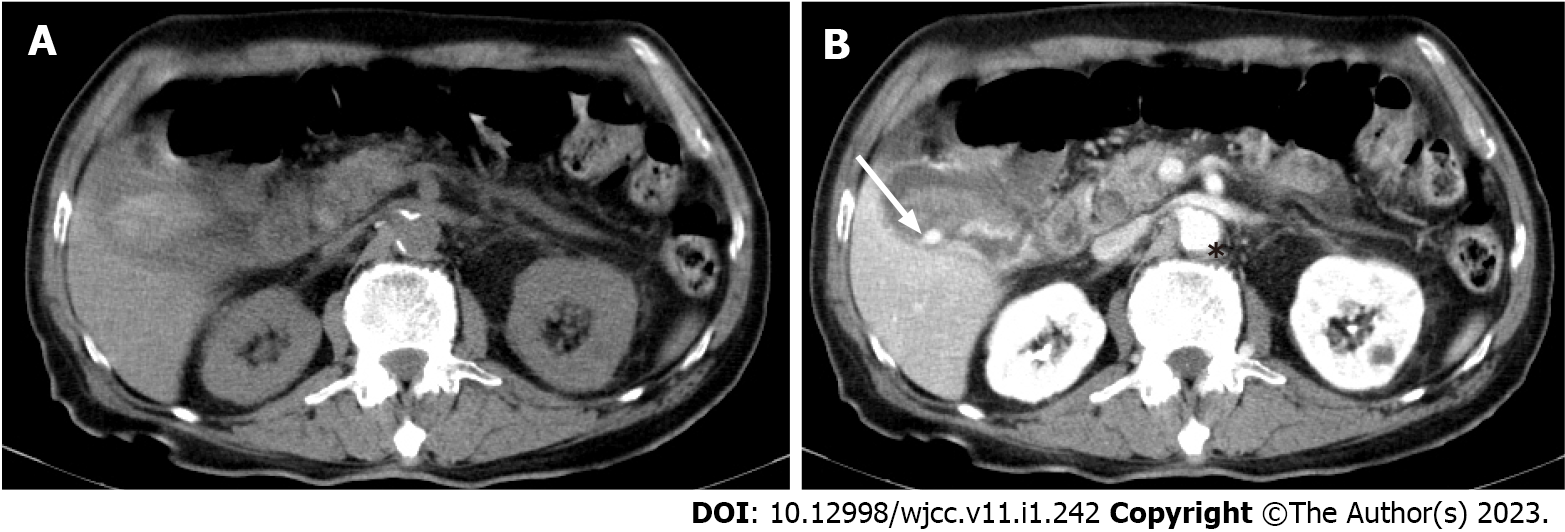
Figure 1 Axial view of abdominal computed tomography.
A: In the precontrast phase, the gallbladder is ill defined with areas of increased attenuation; B: In the arterial phase, pseudoaneurysm can be clearly observed as a well-defined hyperattenuated nodule (white arrow) inside the gallbladder with similar attenuation to aorta (*).
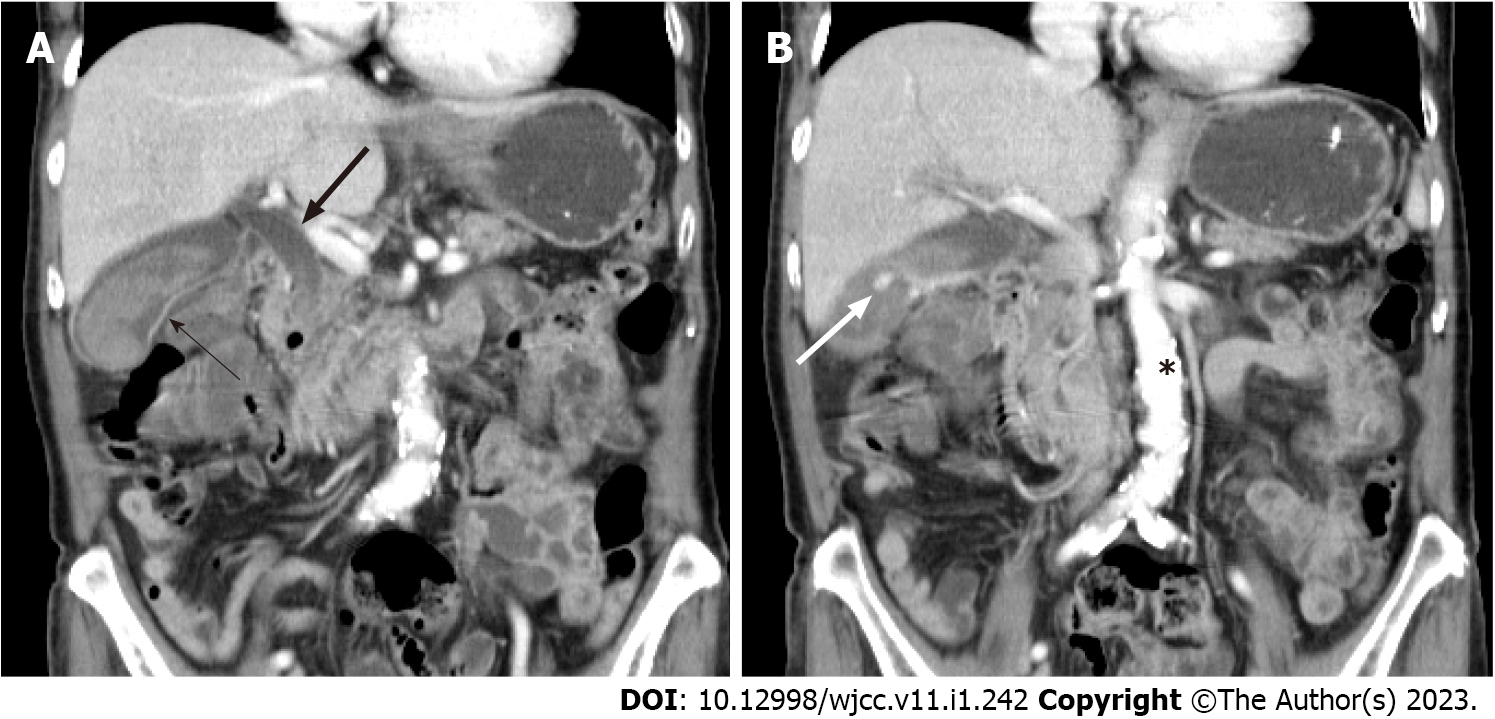
Figure 2 Sagittal views of contrast-enhanced abdominal computed tomography.
A: A thin-walled gallbladder with wall enhancement (thin arrow) with common bile duct dilatation (thick arrow); B: A hyperattenuated pseudoaneurysm (white arrow) and atherosclerotic aorta (*).
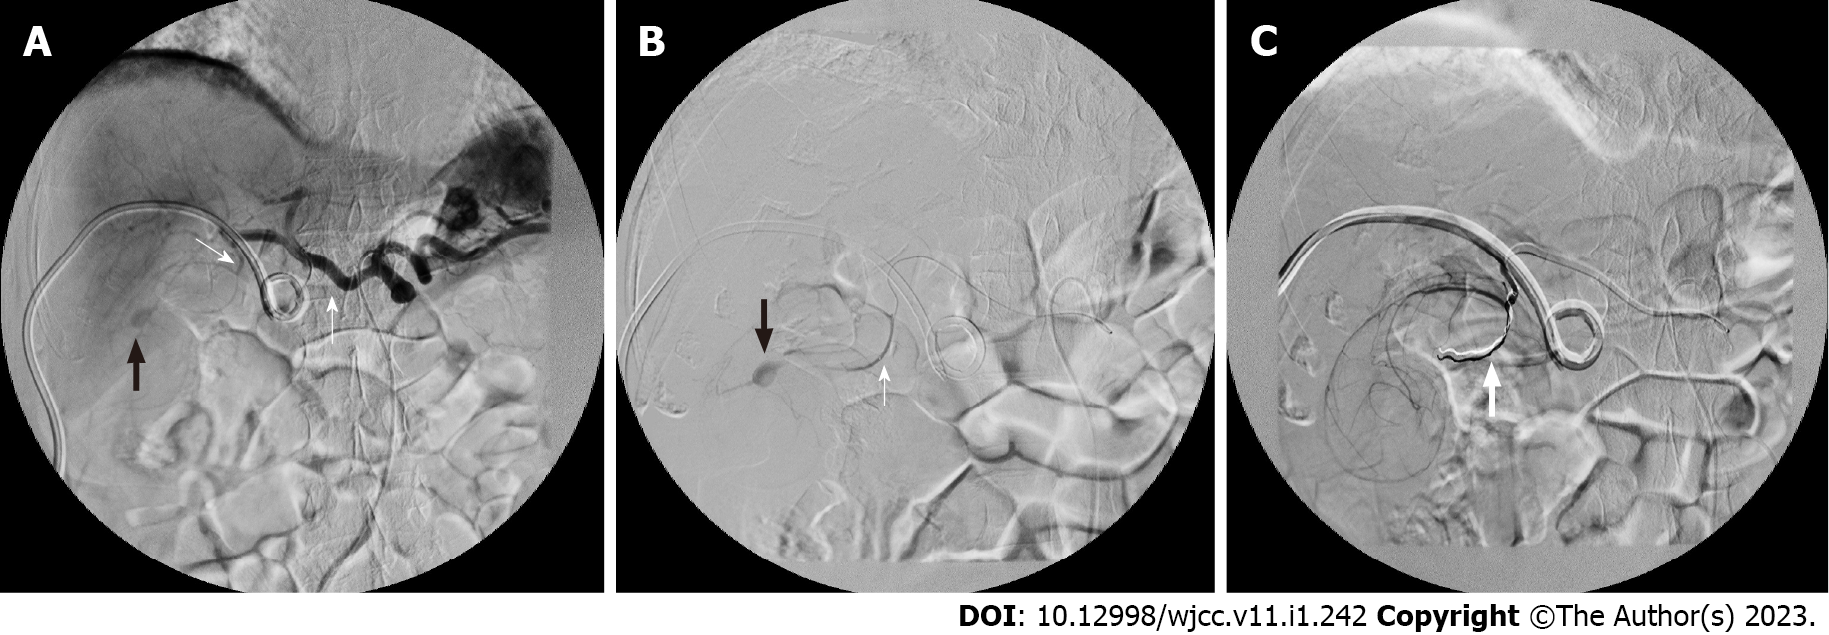
Figure 3 Digital subtraction angiography.
A: Celiac artery angiography showing common hepatic artery (thick white arrow), cystic artery (thin white arrow) and pseudoaneurysm (black arrow); B: Hyperselective cannulation of a branch of the cystic artery, showing the coil (thick white arrow) and pseudoaneurysm (black arrow); C: Pseudoaneurysm can no longer be observed after embolization. The coil is marked with white arrow.
- Citation: Liu YL, Hsieh CT, Yeh YJ, Liu H. Cystic artery pseudoaneurysm: A case report. World J Clin Cases 2023; 11(1): 242-248
- URL: https://www.wjgnet.com/2307-8960/full/v11/i1/242.htm
- DOI: https://dx.doi.org/10.12998/wjcc.v11.i1.242


