Copyright
©The Author(s) 2022.
World J Clin Cases. Nov 26, 2022; 10(33): 12278-12288
Published online Nov 26, 2022. doi: 10.12998/wjcc.v10.i33.12278
Published online Nov 26, 2022. doi: 10.12998/wjcc.v10.i33.12278
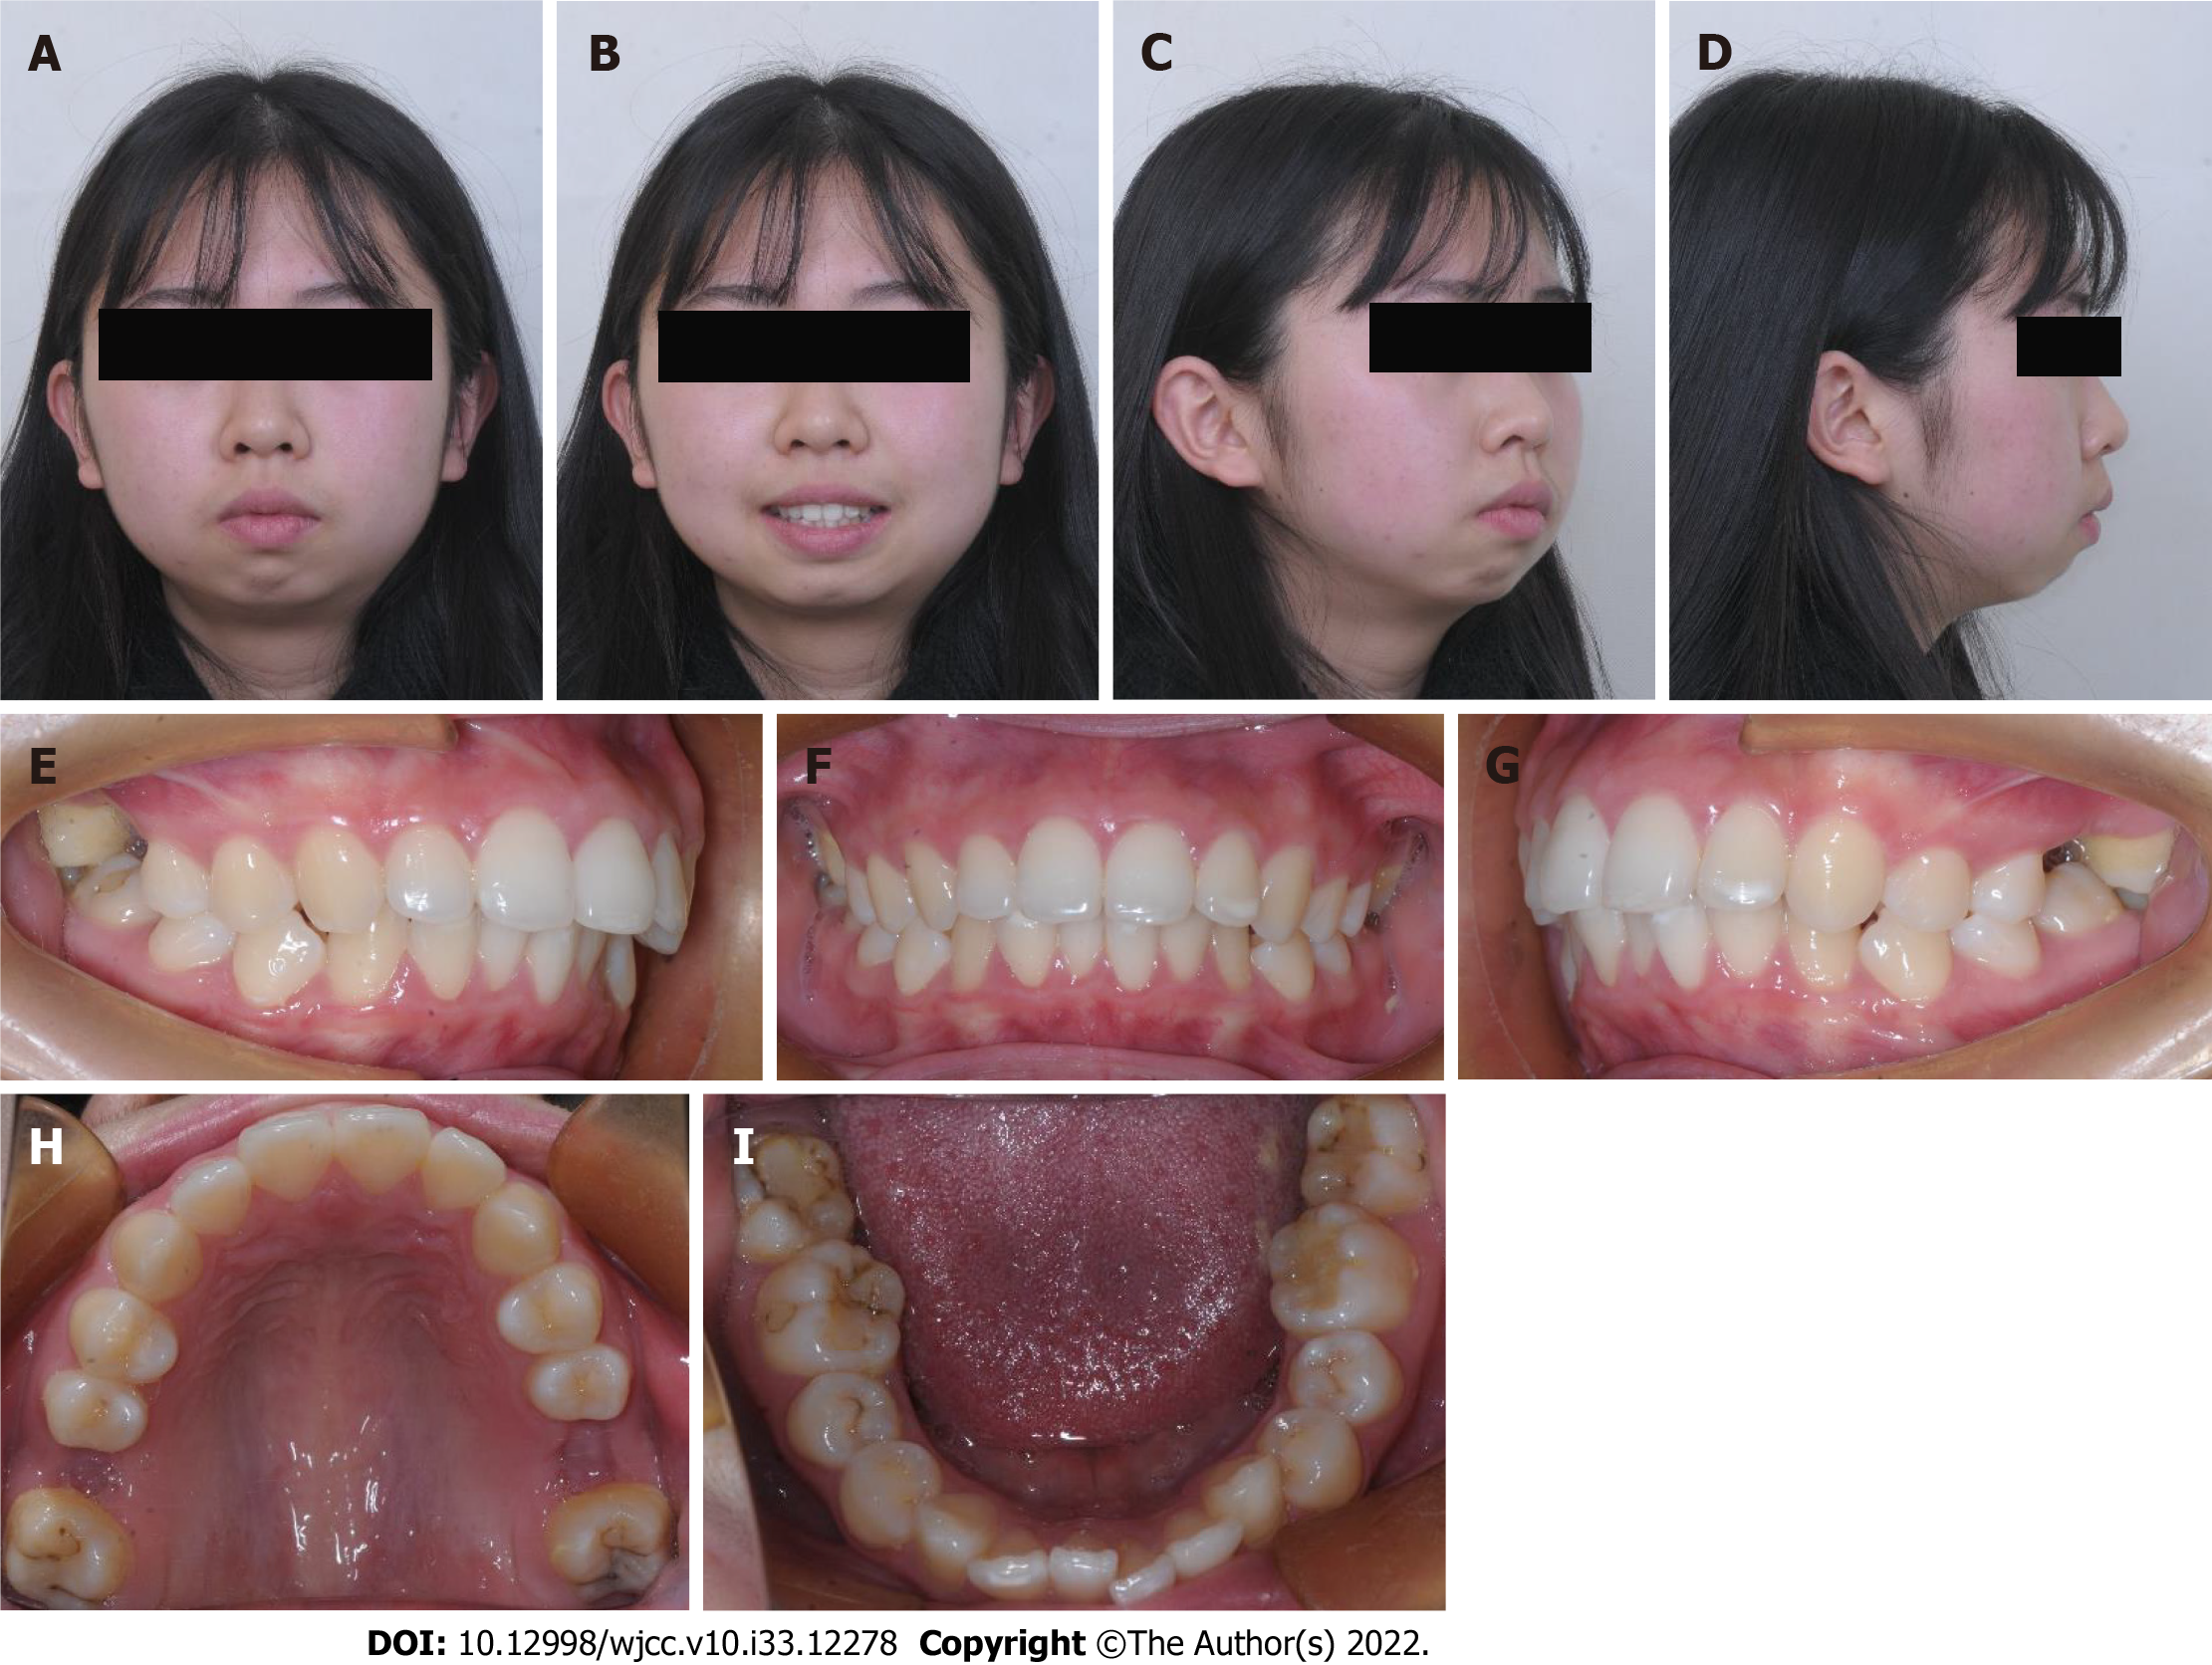
Figure 1 Pre-treatment facial and intraoral images.
A-D: Facial images; E-I: Intraoral images.
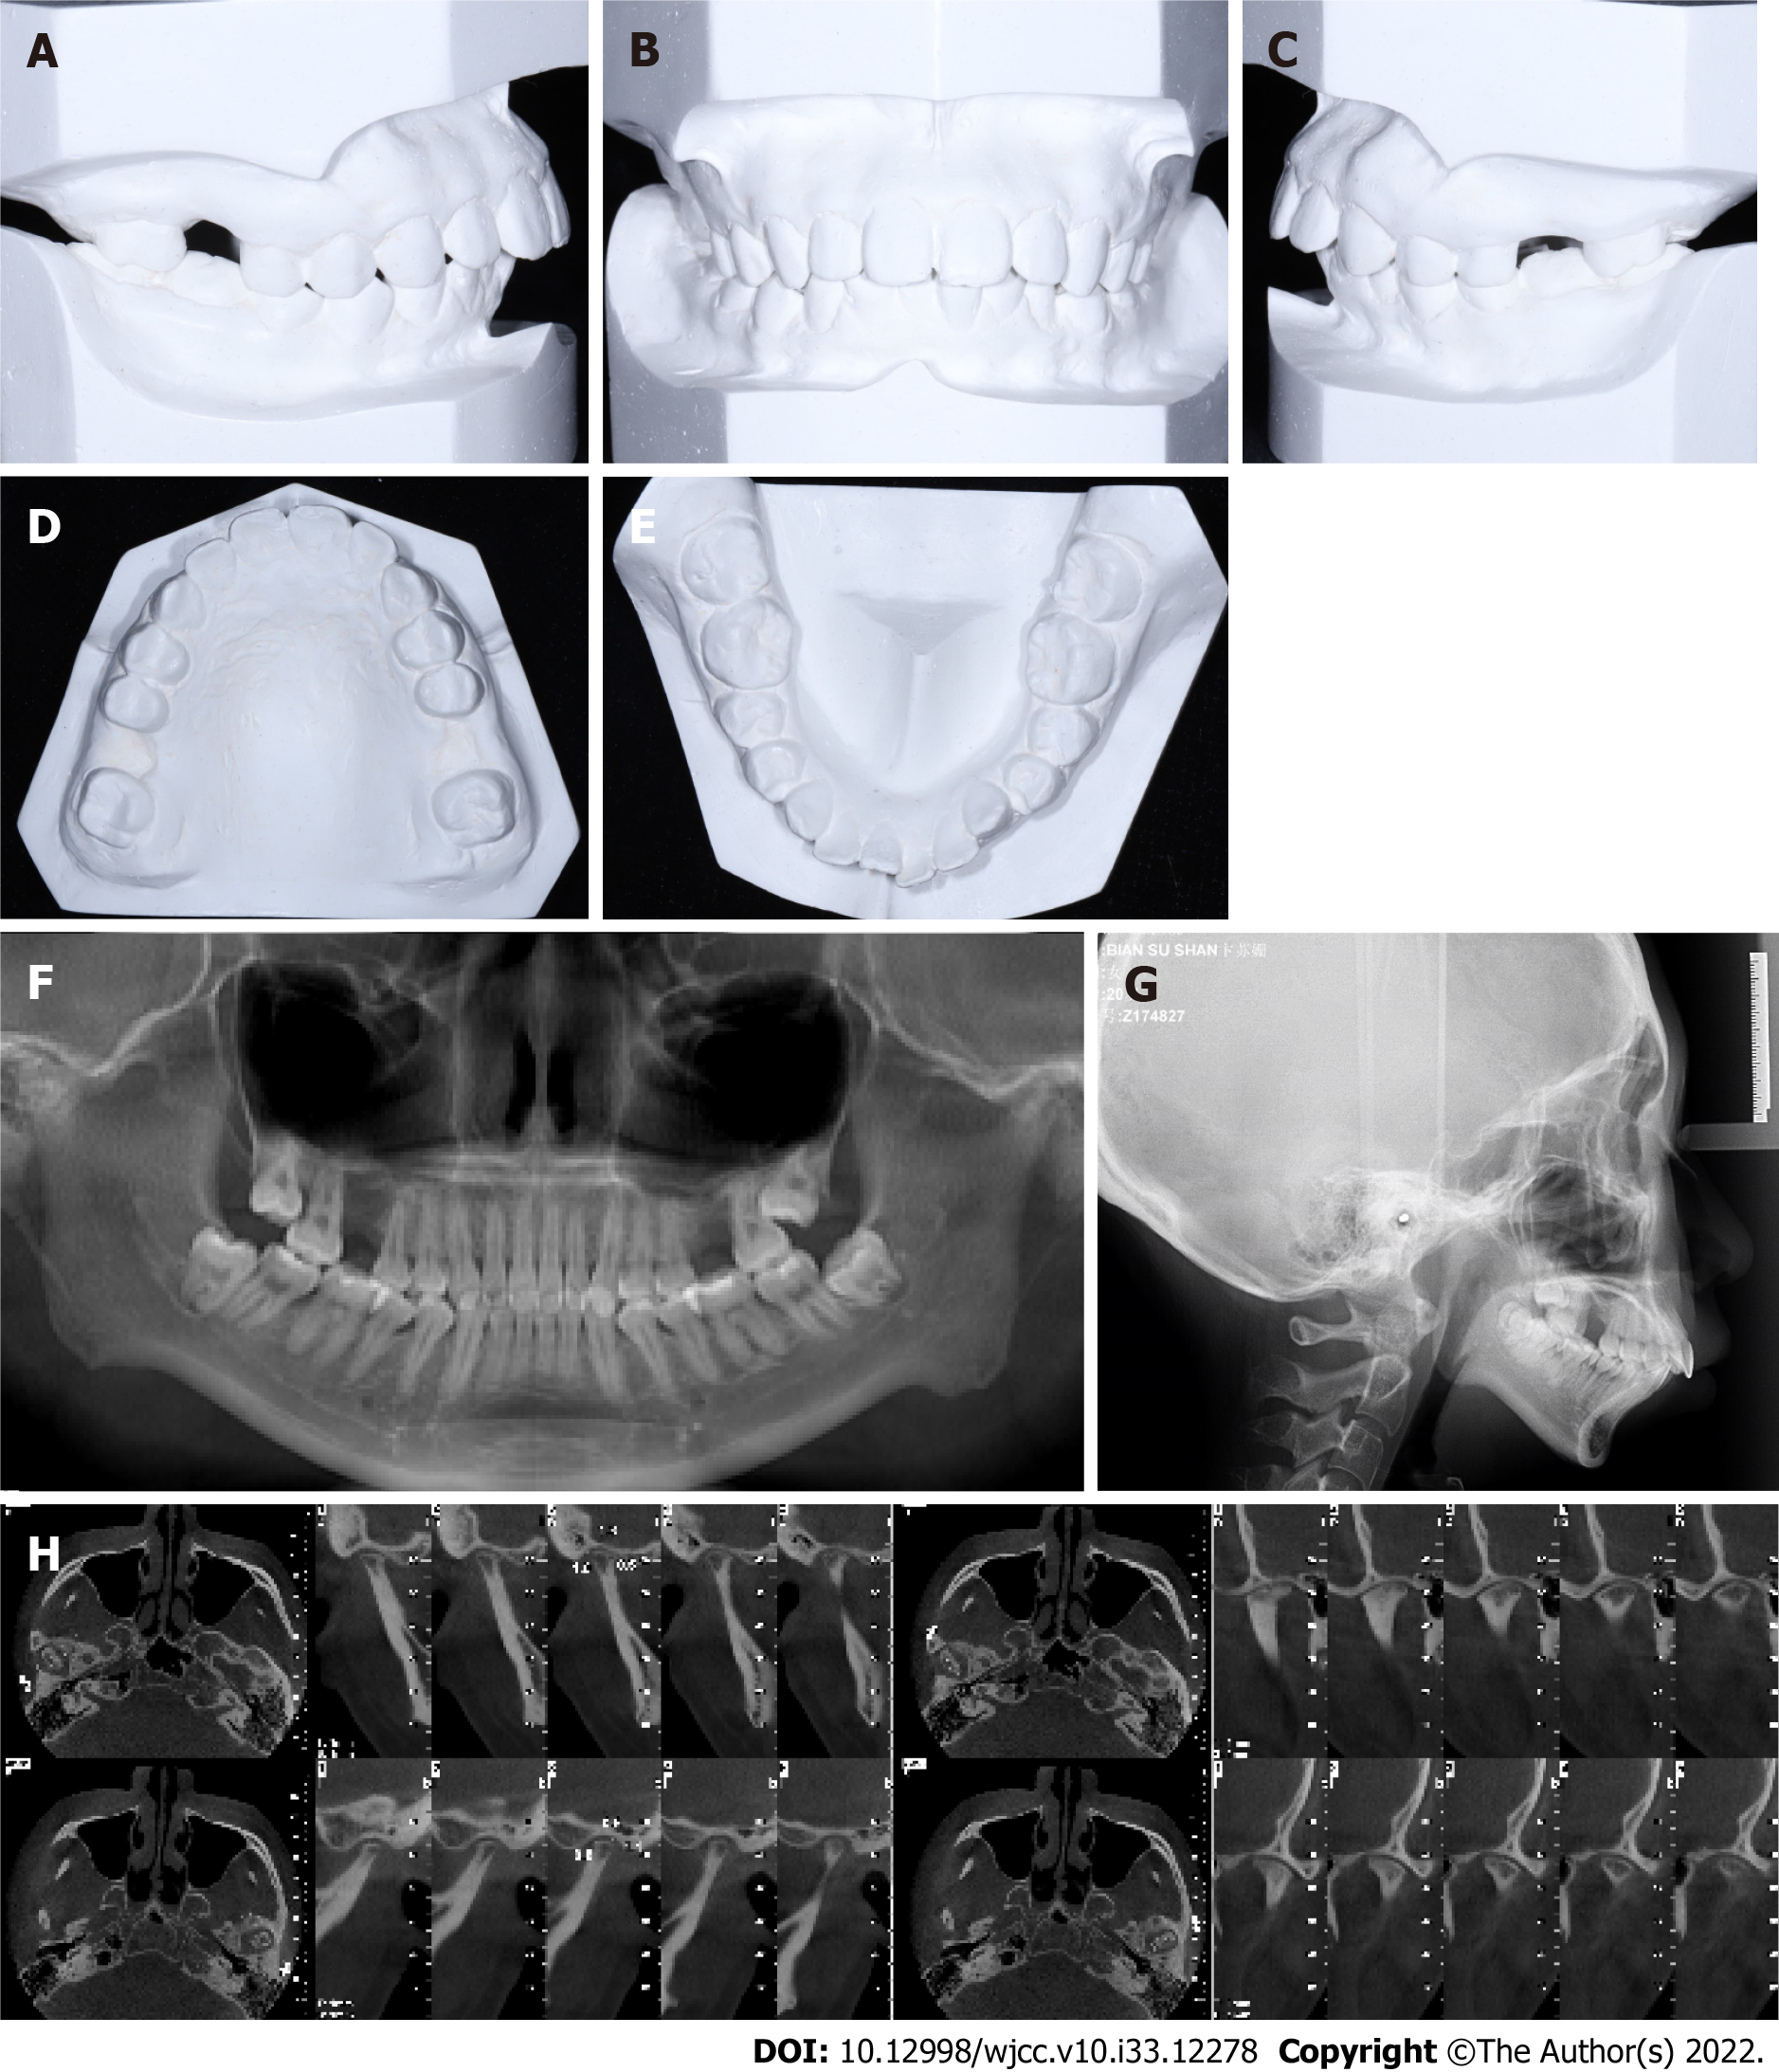
Figure 2 Pre-treatment.
A-E: Model images; F and G: Panoramic and lateral cephalometric radiographs; H: Temporomandibular joint images.
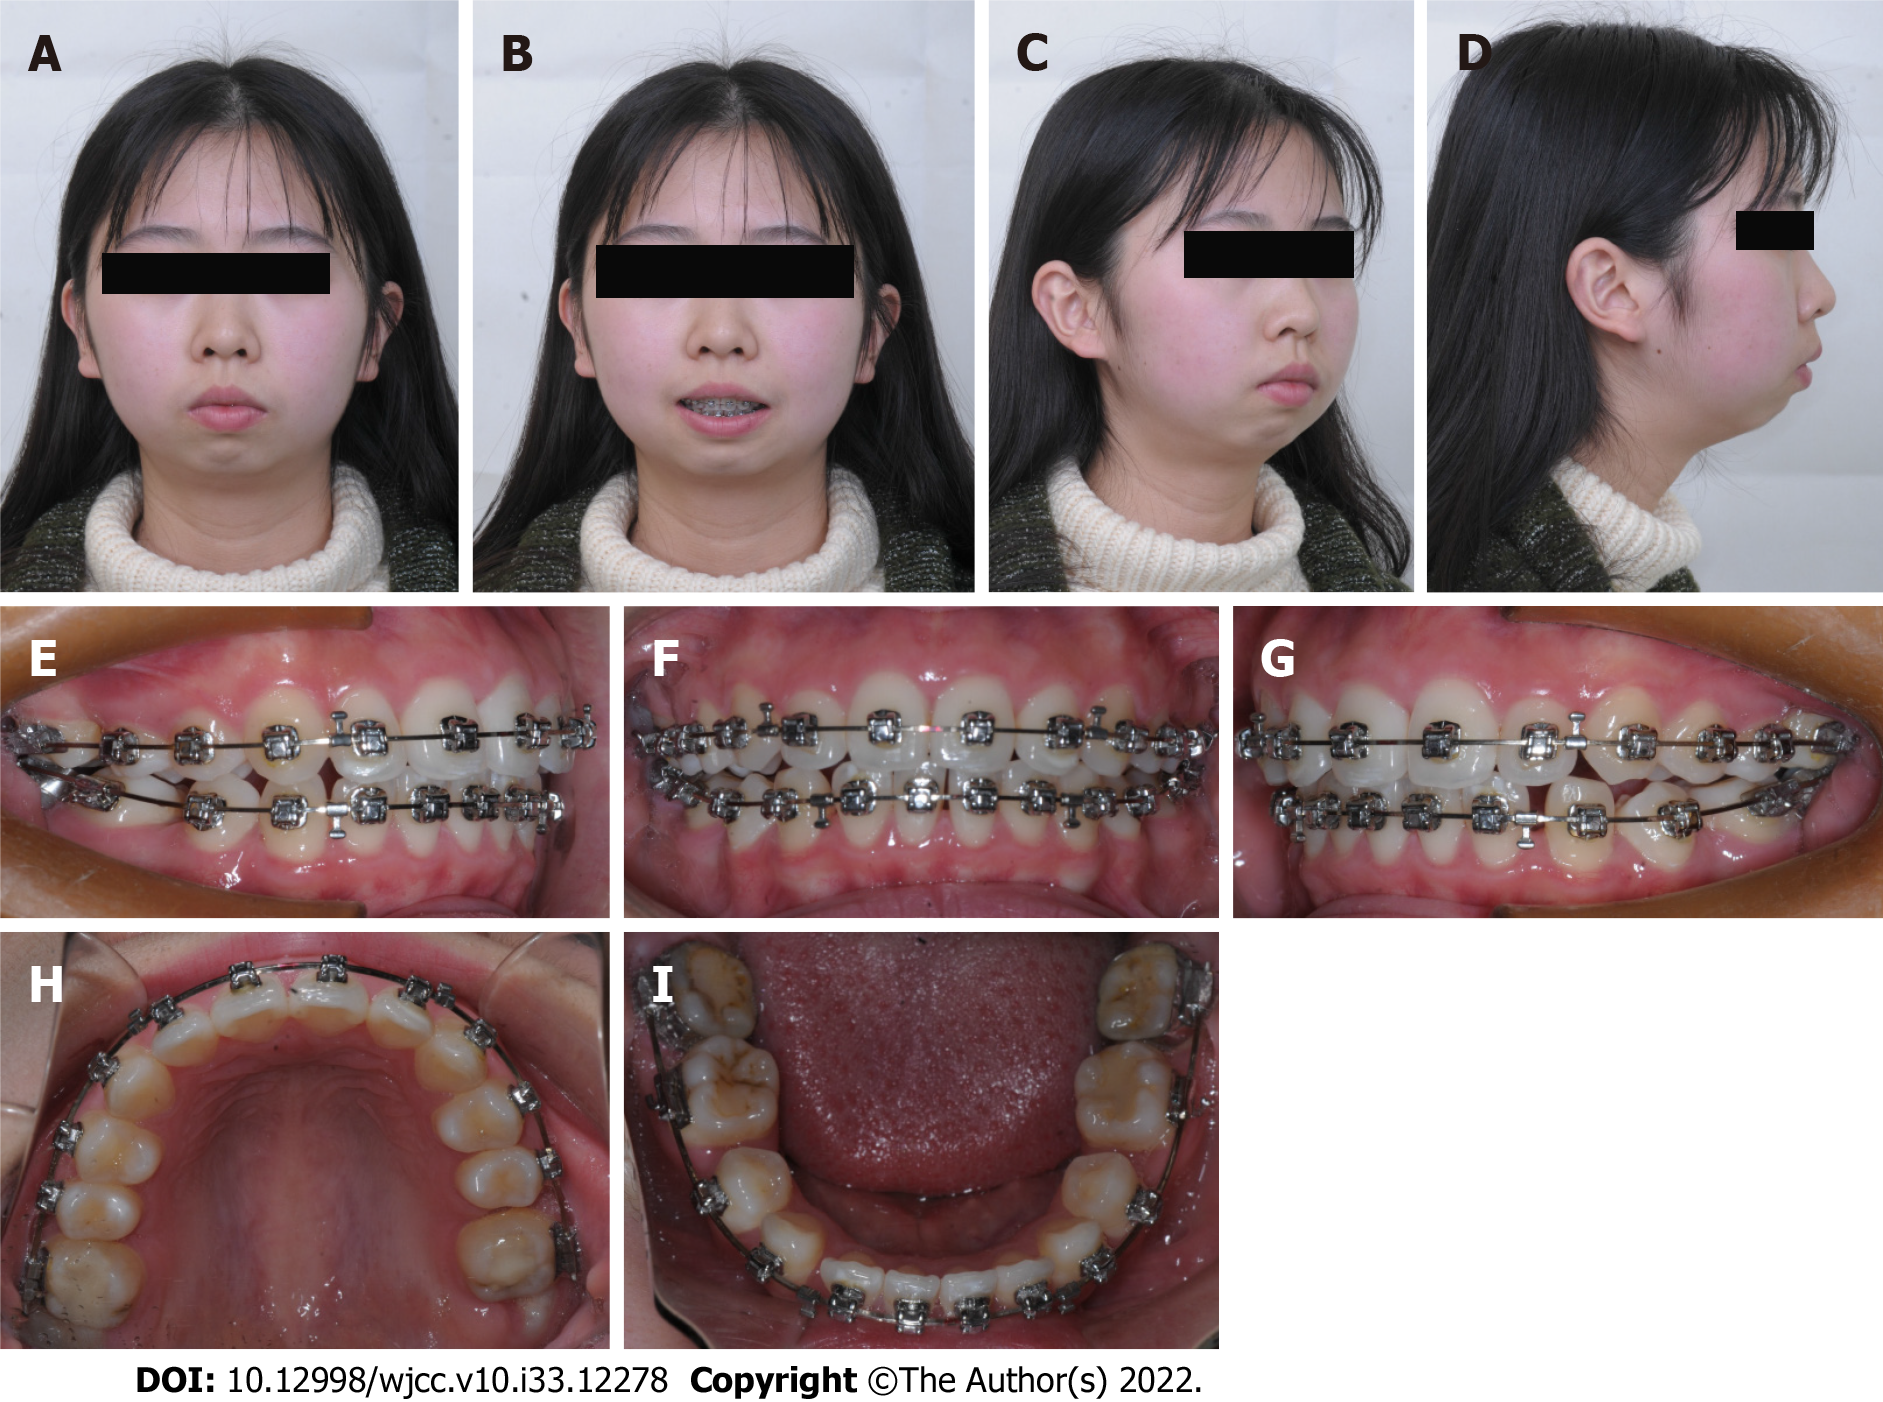
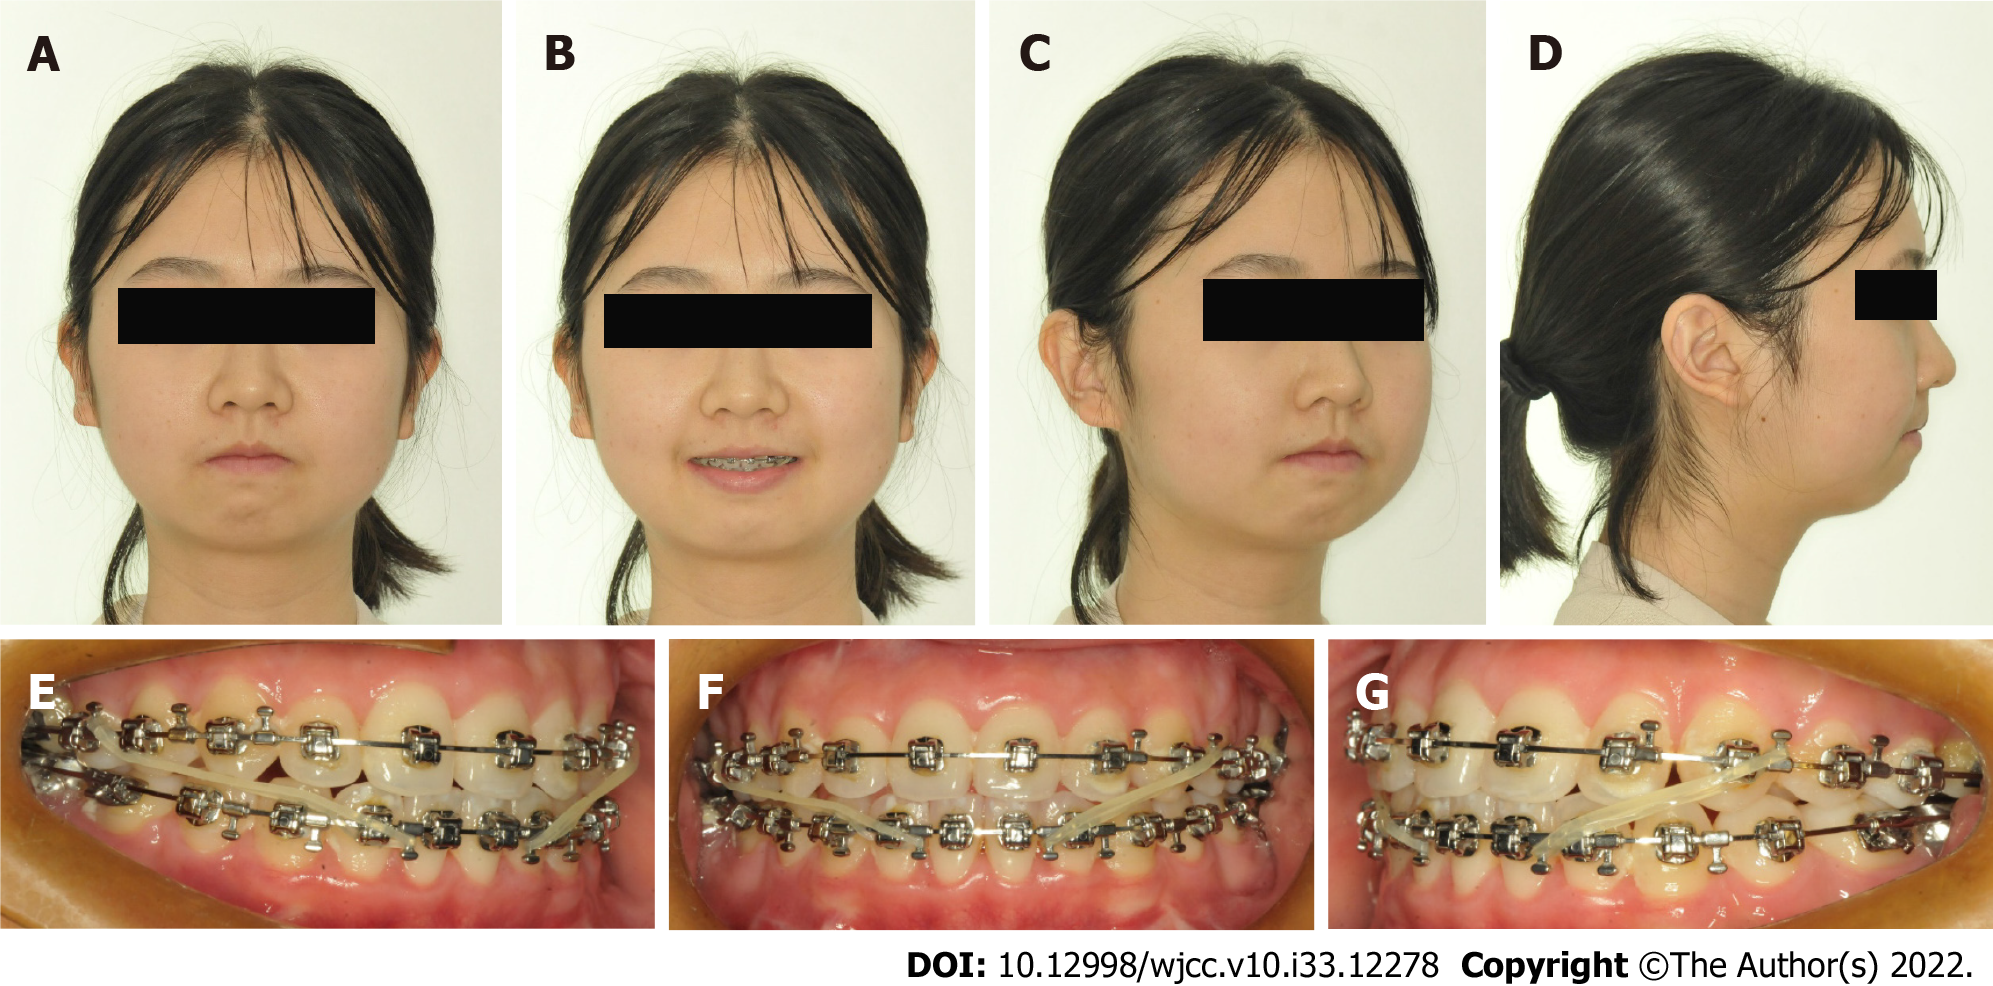
Figure 3 Facial and intraoral images during pre-surgical orthodontic treatment.
A-D: Facial images; E-I: Intraoral images.
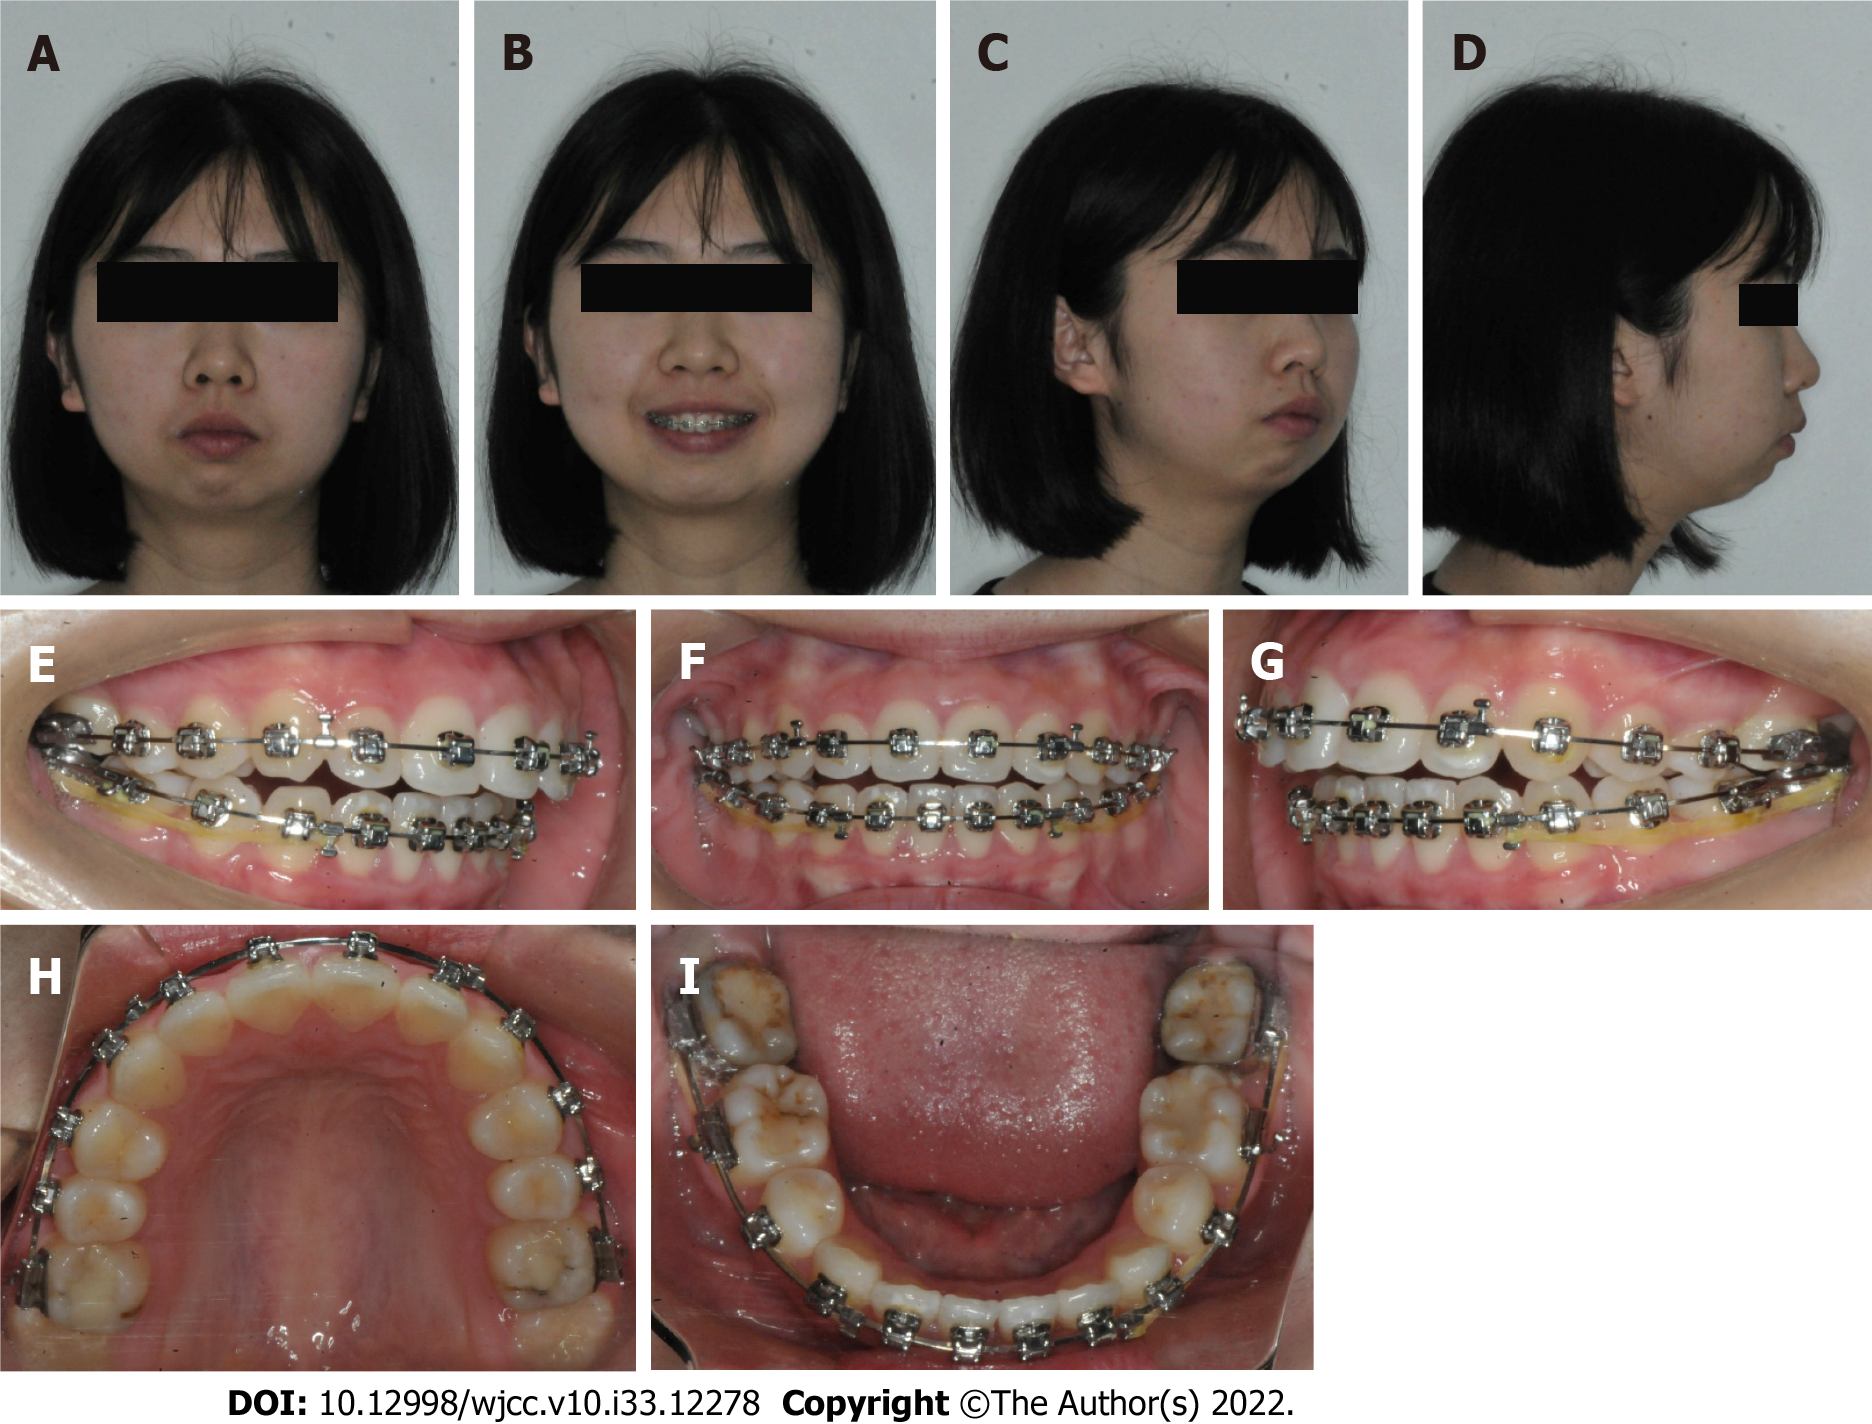
Figure 4 Facial and intraoral images before surgery.
A-D: Facial images; E-I: Intraoral images.
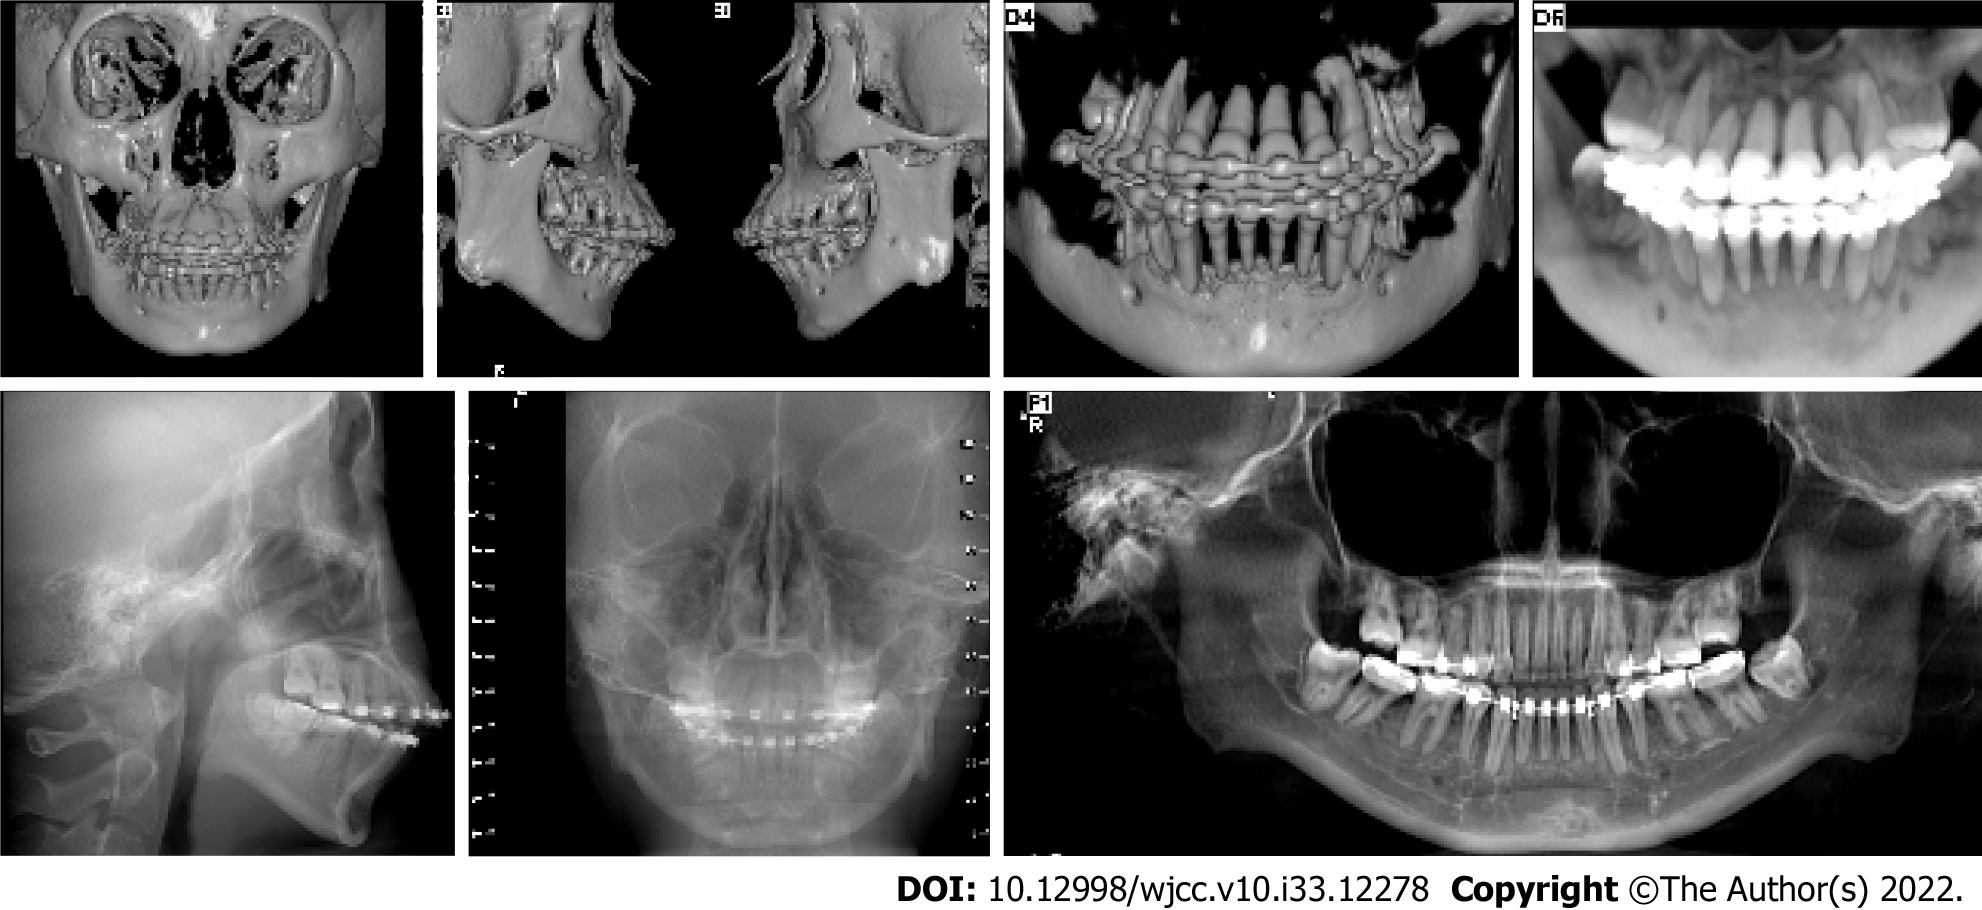
Figure 5 Cone-beam computed tomography images before surgery.
Figure 6 Facial and intraoral images after stage I surgery.
A-D: Facial images; E-G: Intraoral images.
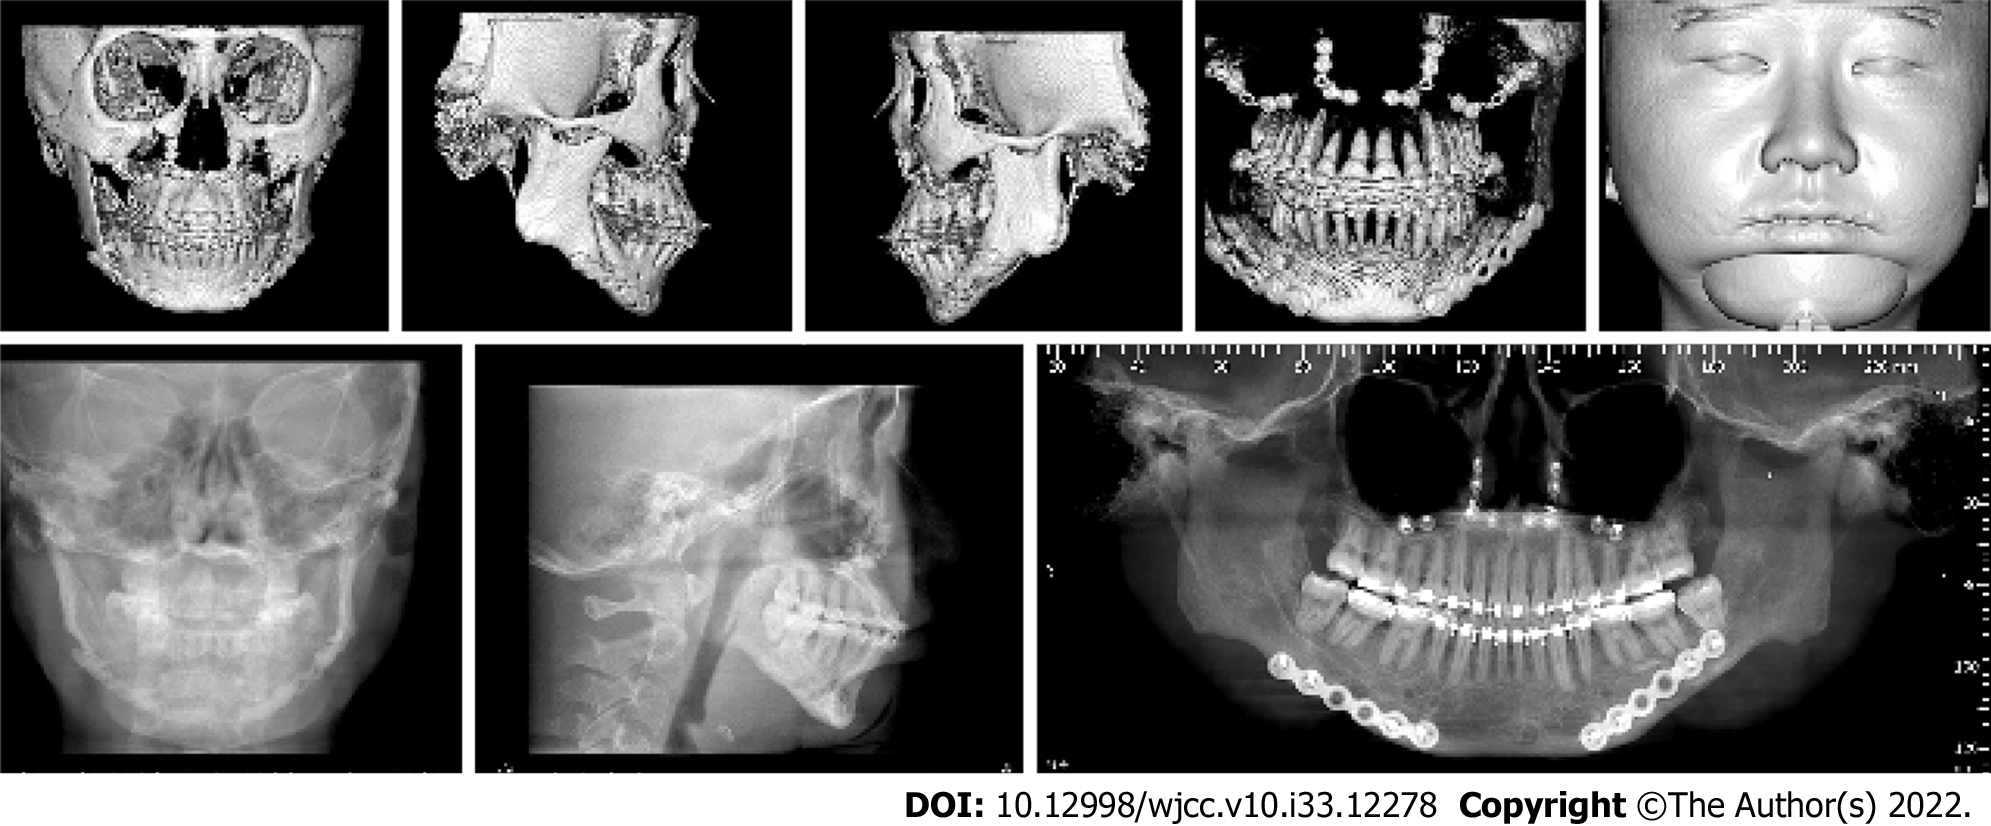
Figure 7 Cone-beam computed tomography images after stage I surgery.
Figure 8 Facial and intraoral images after treatment.
A-D: Facial images; E-I: Intraoral images.
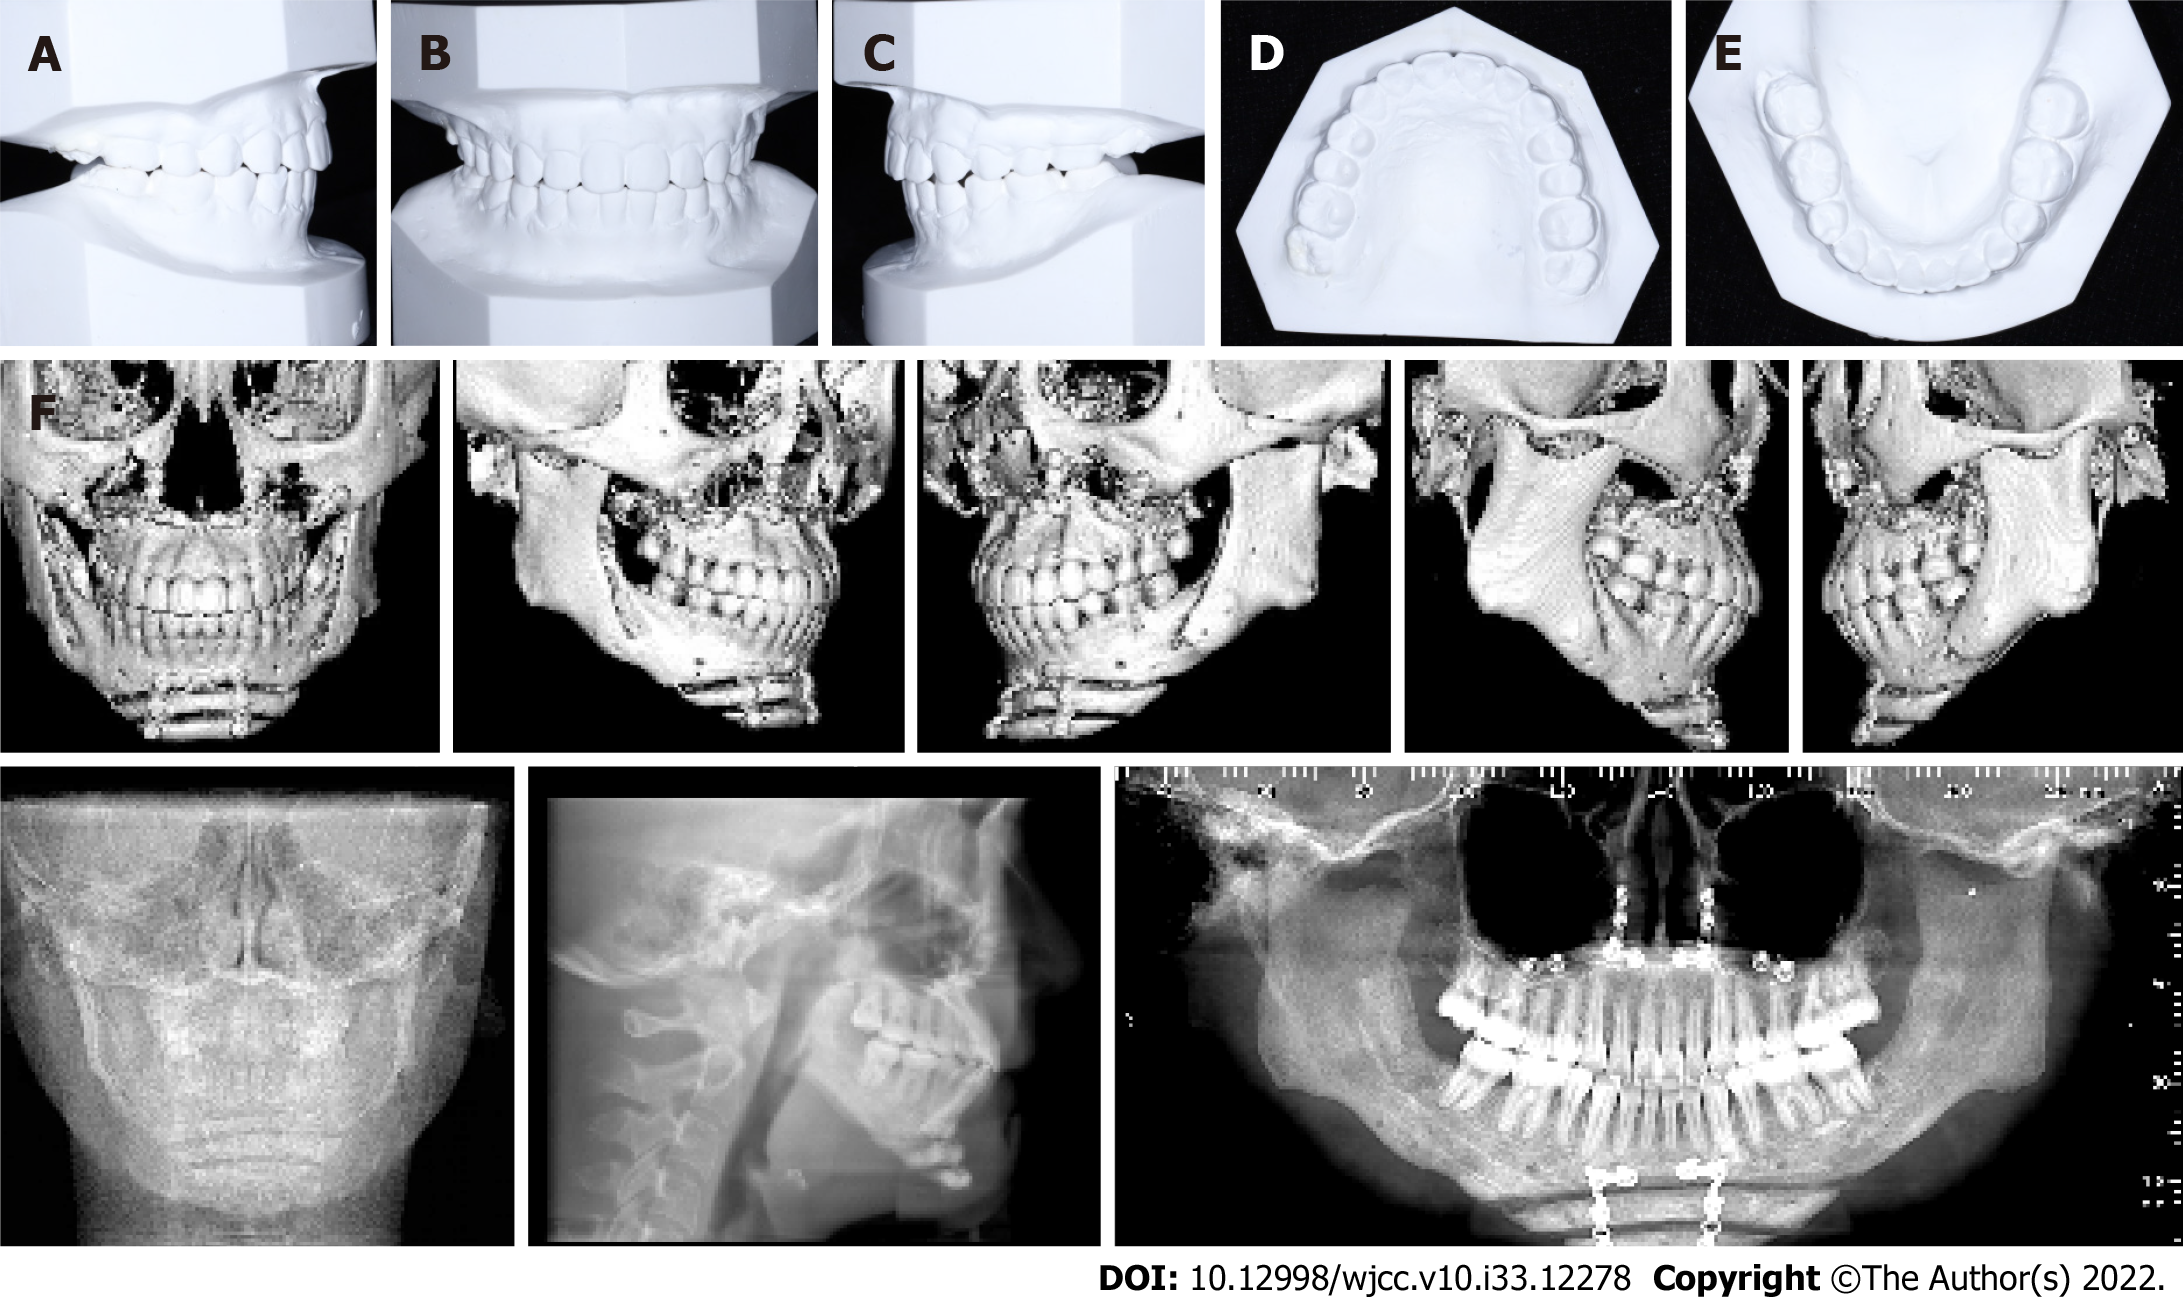
Figure 9 Post-treatment.
A-E: Model images; F: Cone-beam computed tomography images after treatment.
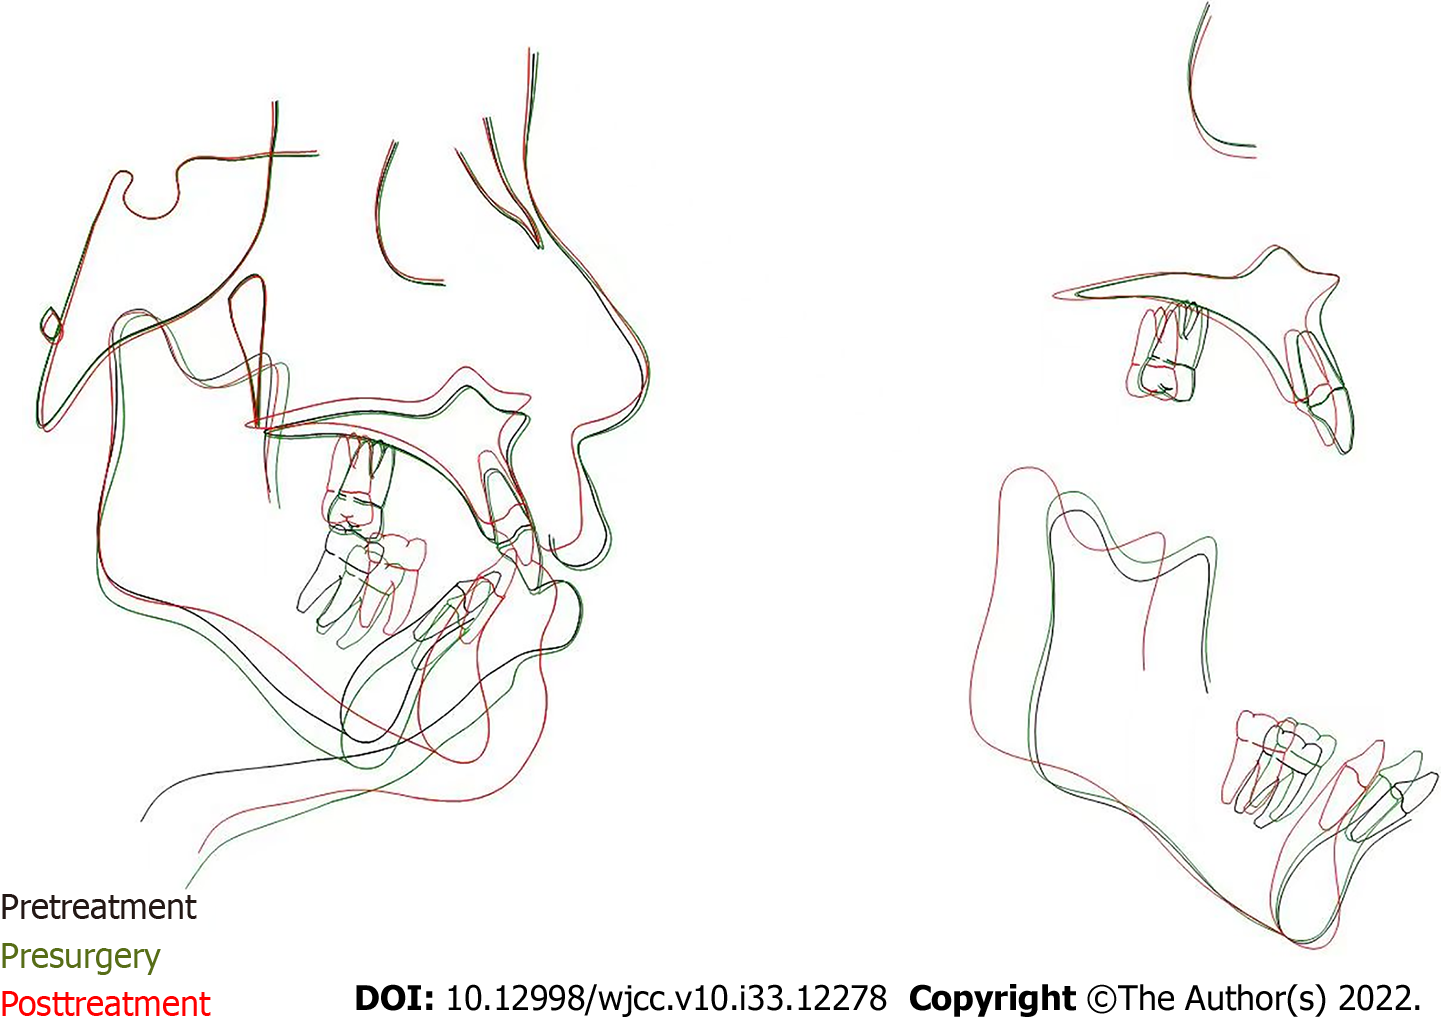
Figure 10 Cephalometric superimposition of pre- and post-treatment lateral tracings.
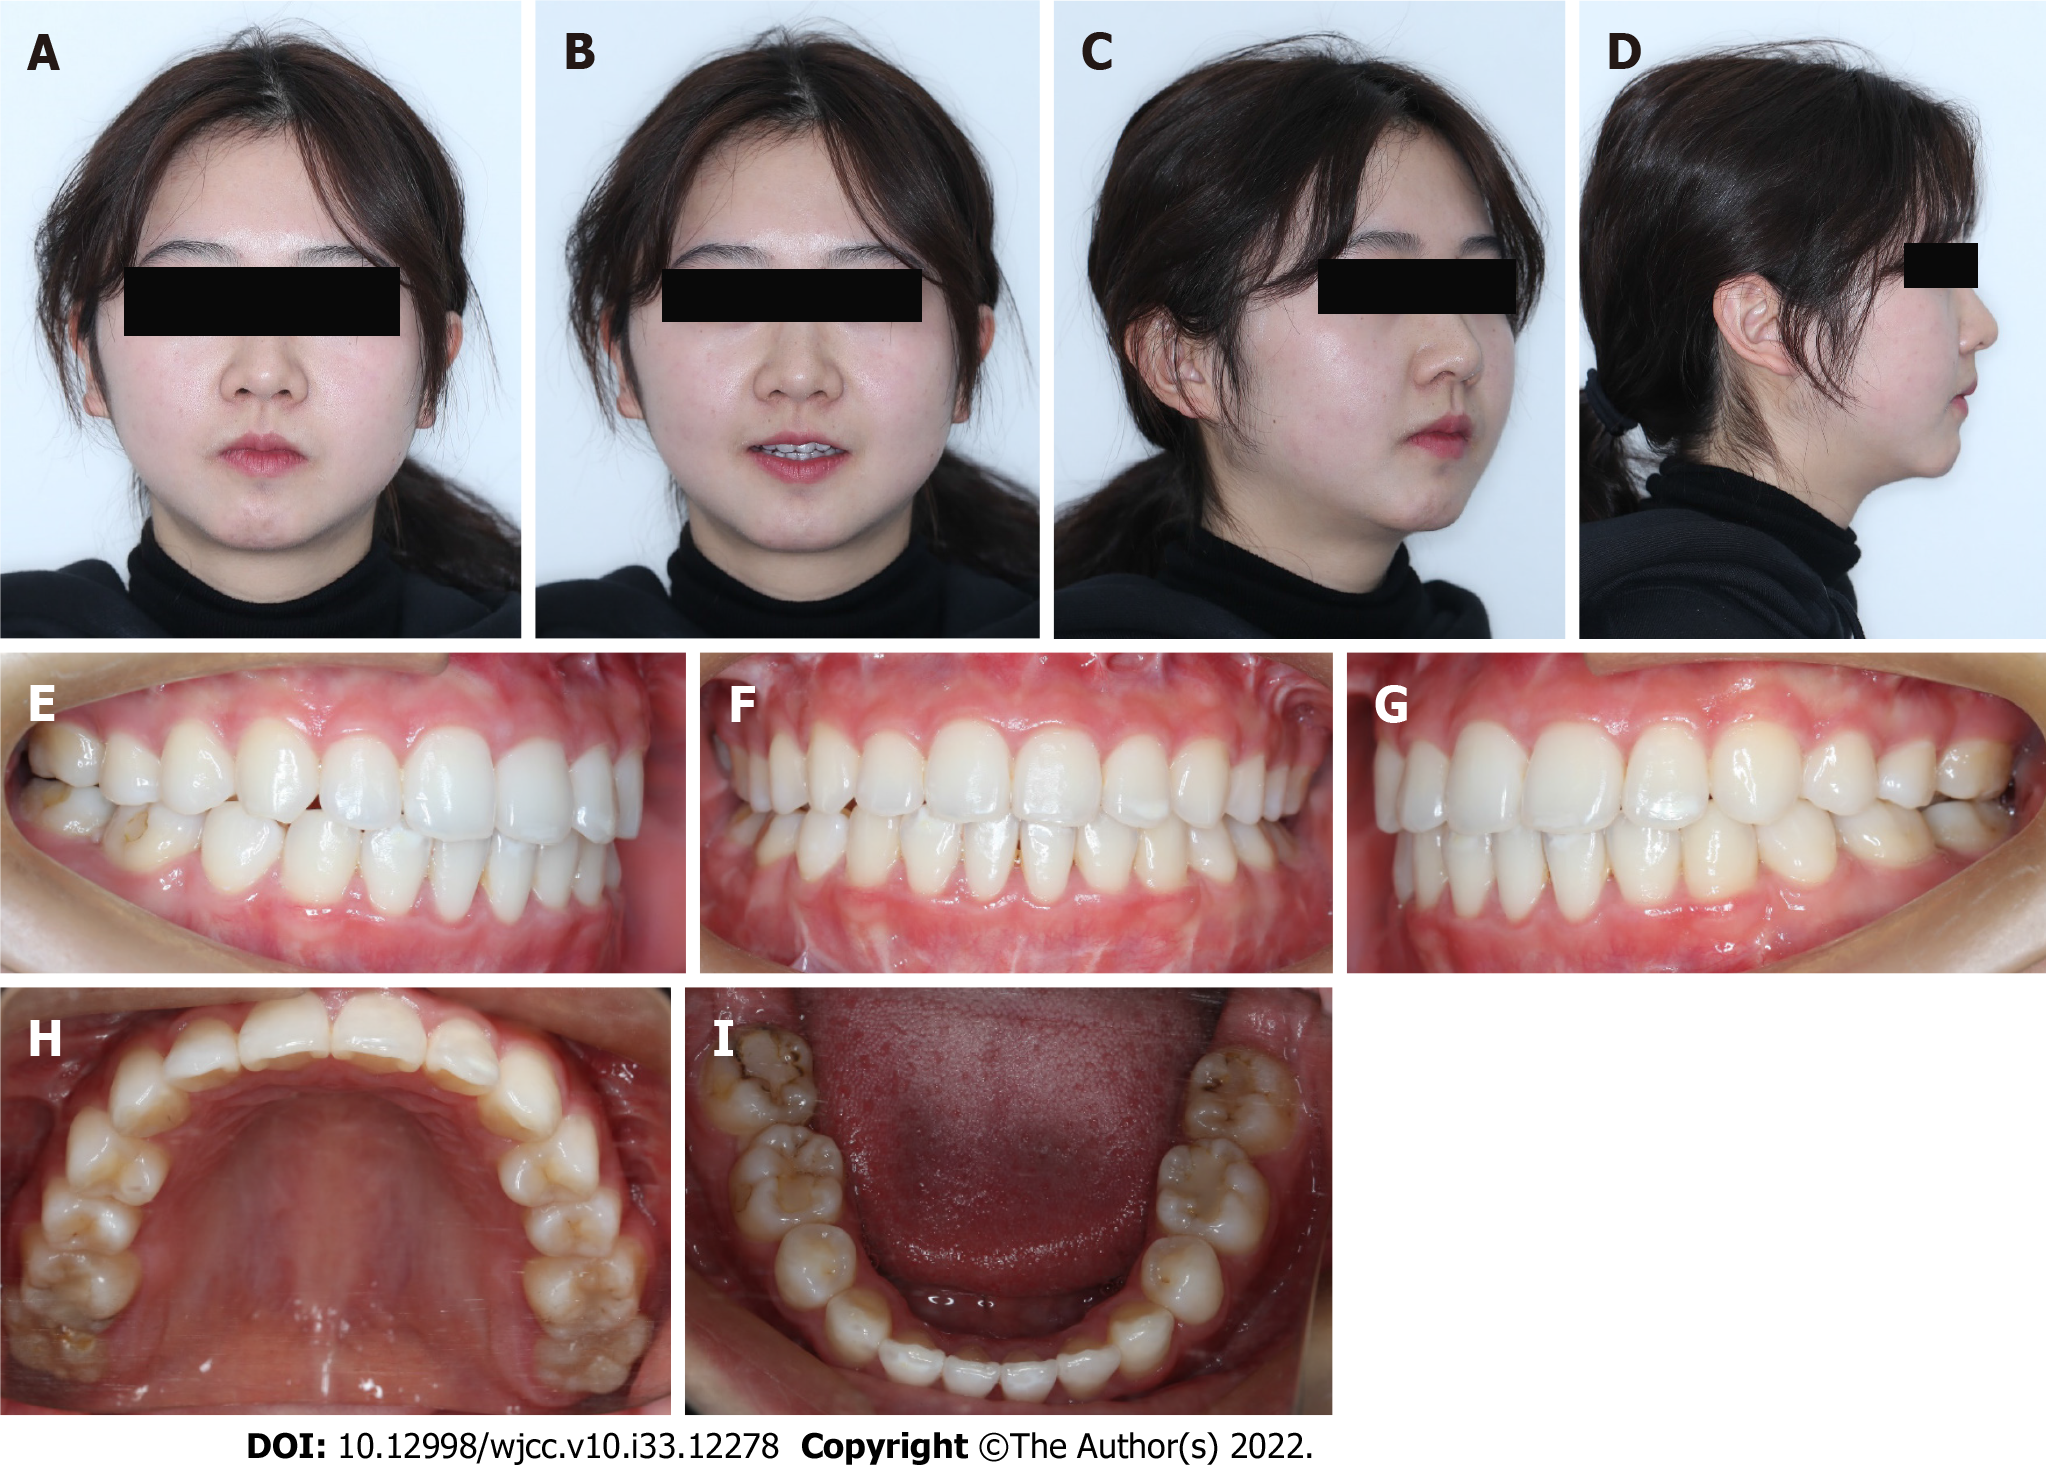
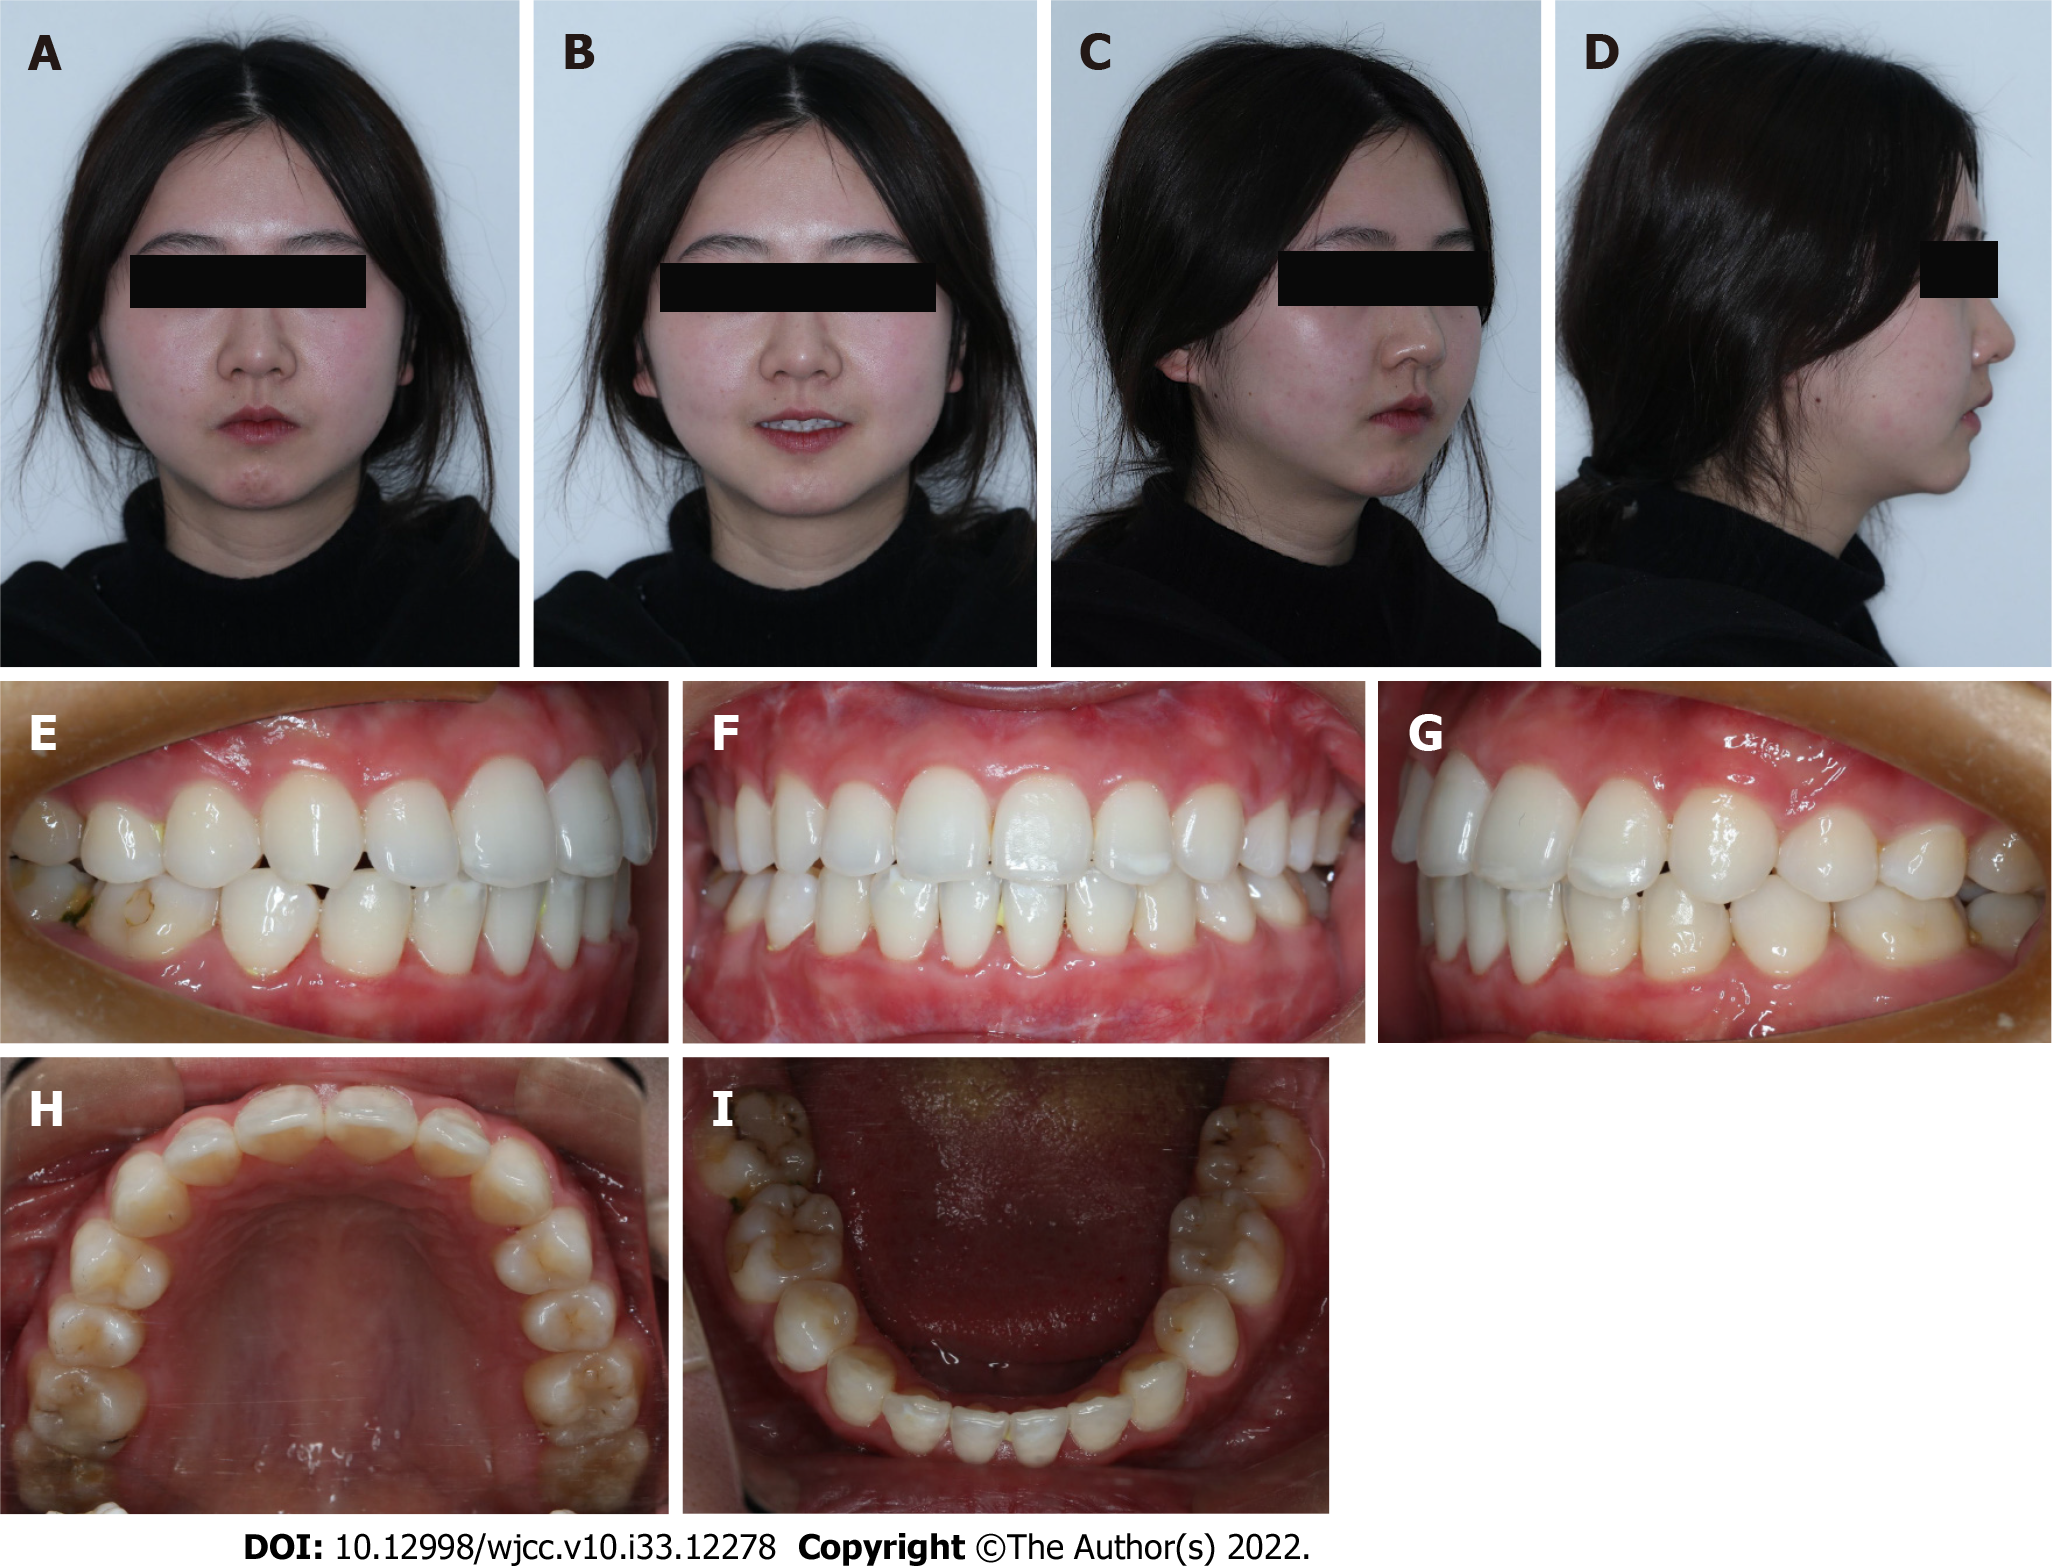
Figure 11 Facial and intraoral images 2 years after debonding.
A-D: Facial images; E-I: Intraoral images.
- Citation: Li GF, Zhang CX, Wen J, Huang ZW, Li H. Orthodontic-surgical treatment of an Angle Class II malocclusion patient with mandibular hypoplasia and missing maxillary first molars: A case report. World J Clin Cases 2022; 10(33): 12278-12288
- URL: https://www.wjgnet.com/2307-8960/full/v10/i33/12278.htm
- DOI: https://dx.doi.org/10.12998/wjcc.v10.i33.12278


