Copyright
©The Author(s) 2022.
World J Clin Cases. Nov 16, 2022; 10(32): 11753-11765
Published online Nov 16, 2022. doi: 10.12998/wjcc.v10.i32.11753
Published online Nov 16, 2022. doi: 10.12998/wjcc.v10.i32.11753
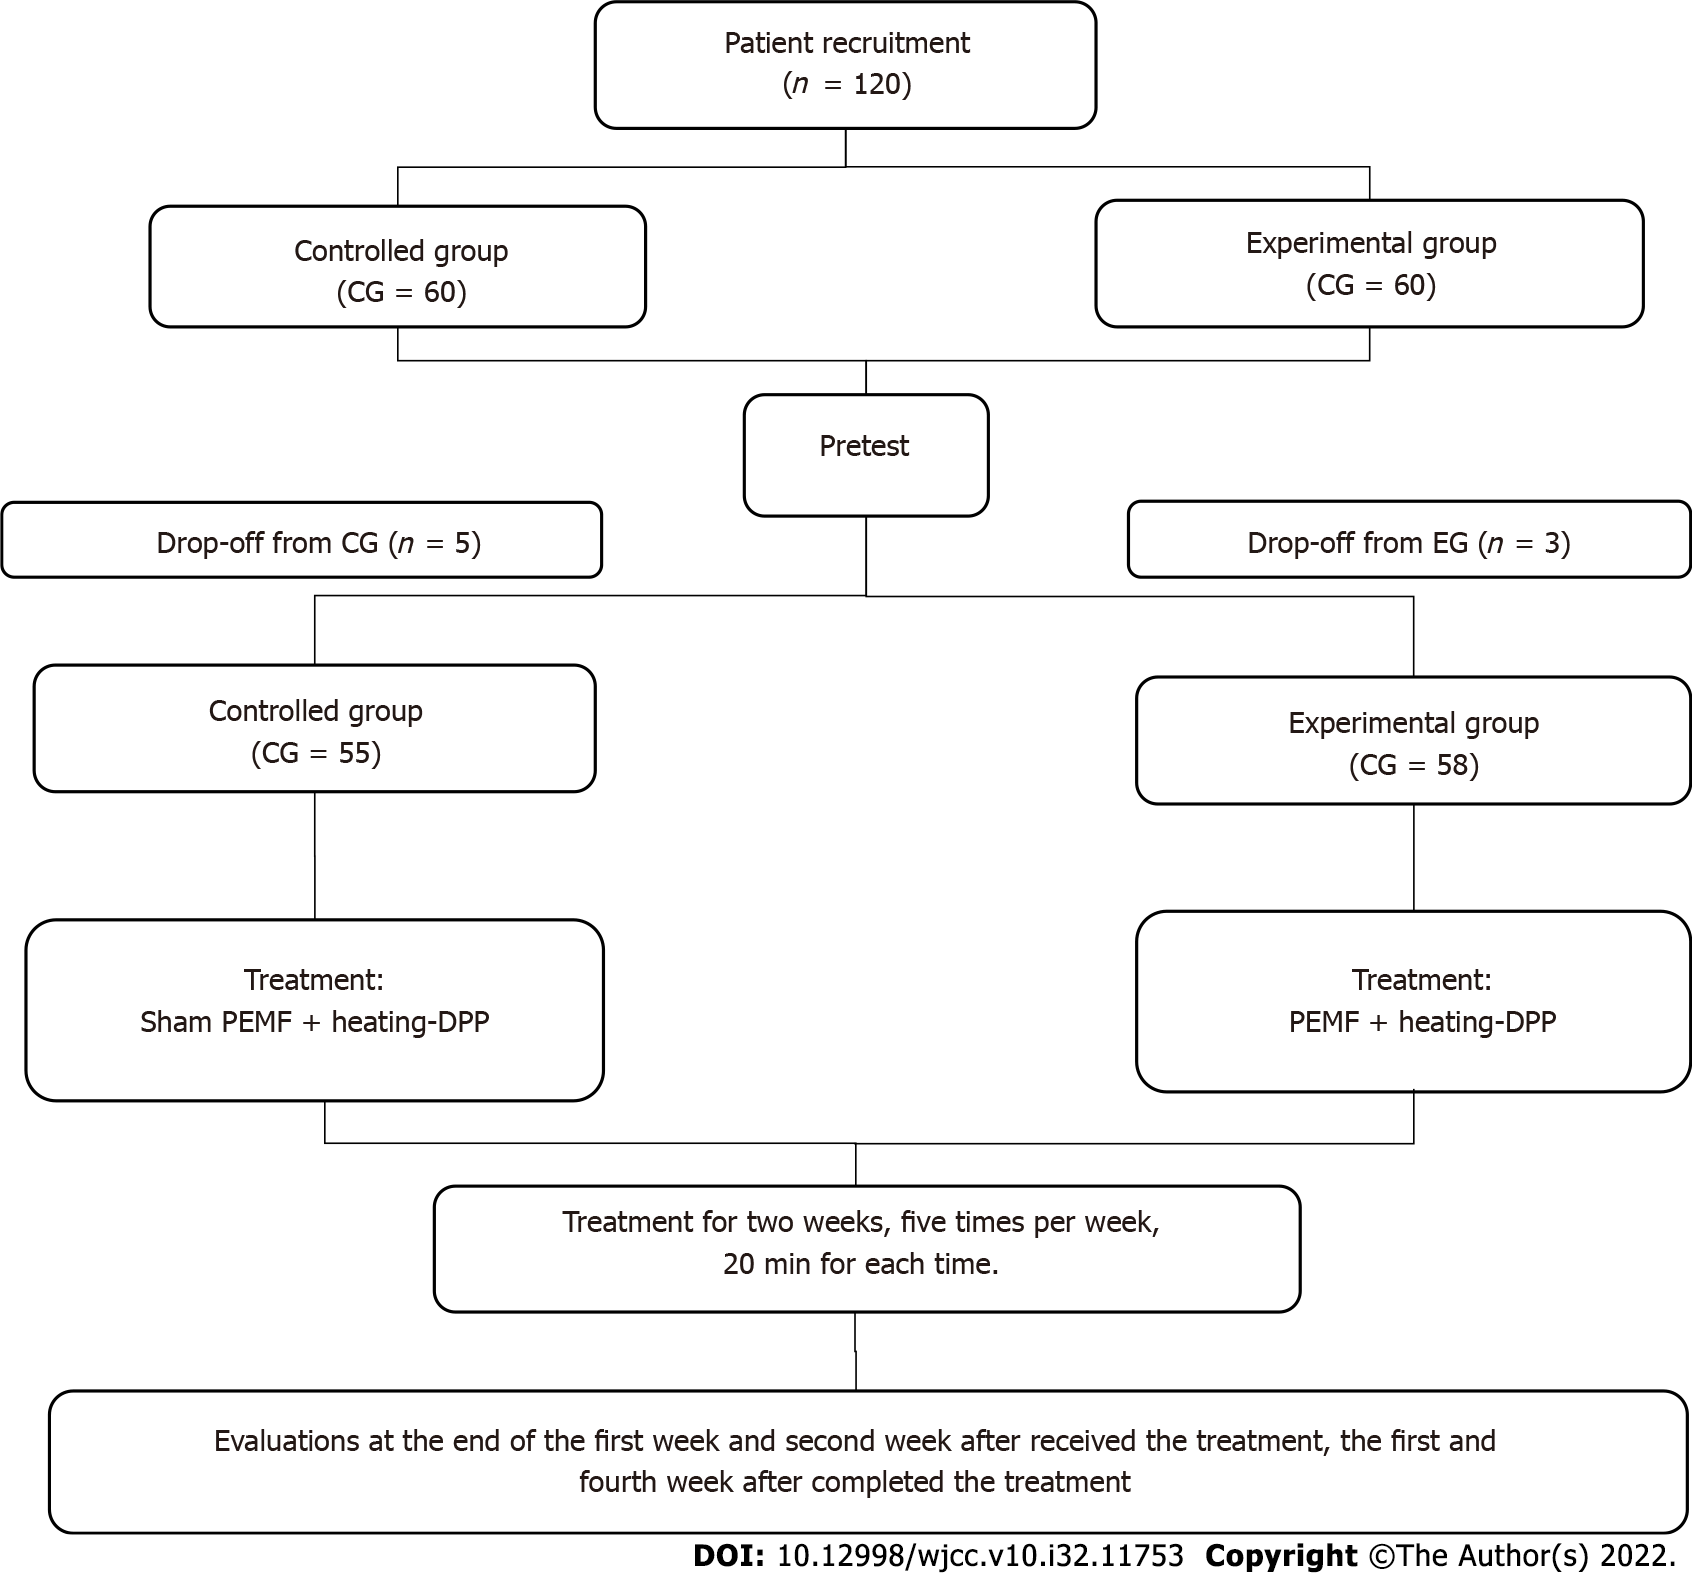
Figure 1 Flow schematic of the study.
CG: Control group; EG: Experimental group; EMFP: Pulsed electromagnetic field; DPP: Damp-clearing and pain-reducing paste.
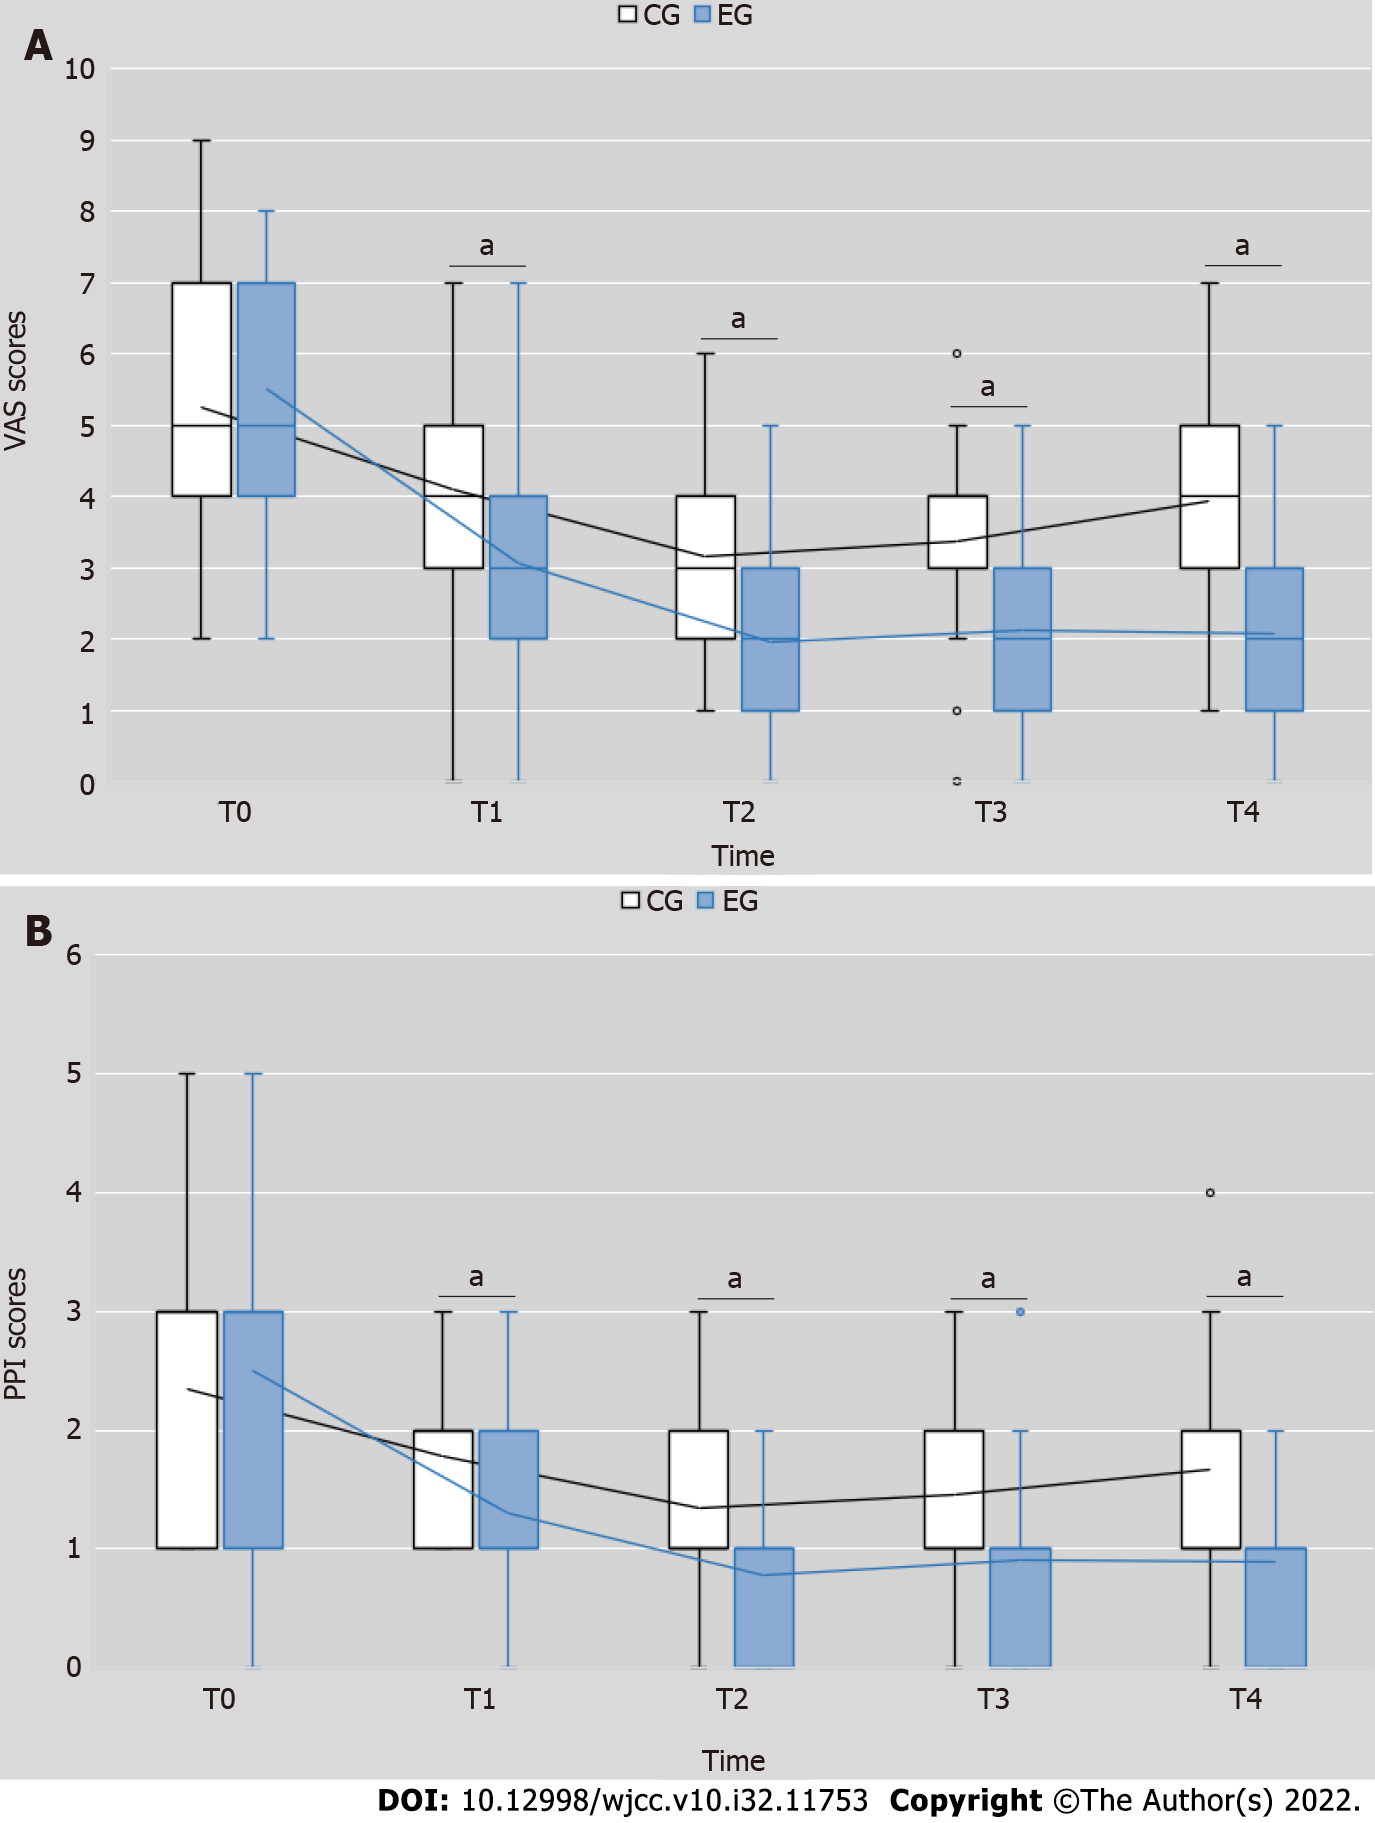
Figure 2 Changes in visual analog scale and present pain intensity index scores after treatment.
A: Visual analog scale scores; B: Present pain intensity index scores. T0 = pretest, T1 = end of the first week after receiving treatment, T2 = end of the second week after receiving treatment, T3 = end of the first week after completing treatment, T4 = end of the fourth week after completing treatment. aP < 0.01, experimental group vs control group. CG: Control group; EG: Experimental group; VAS: Visual analog scale; PPI: Present pain intensity index.
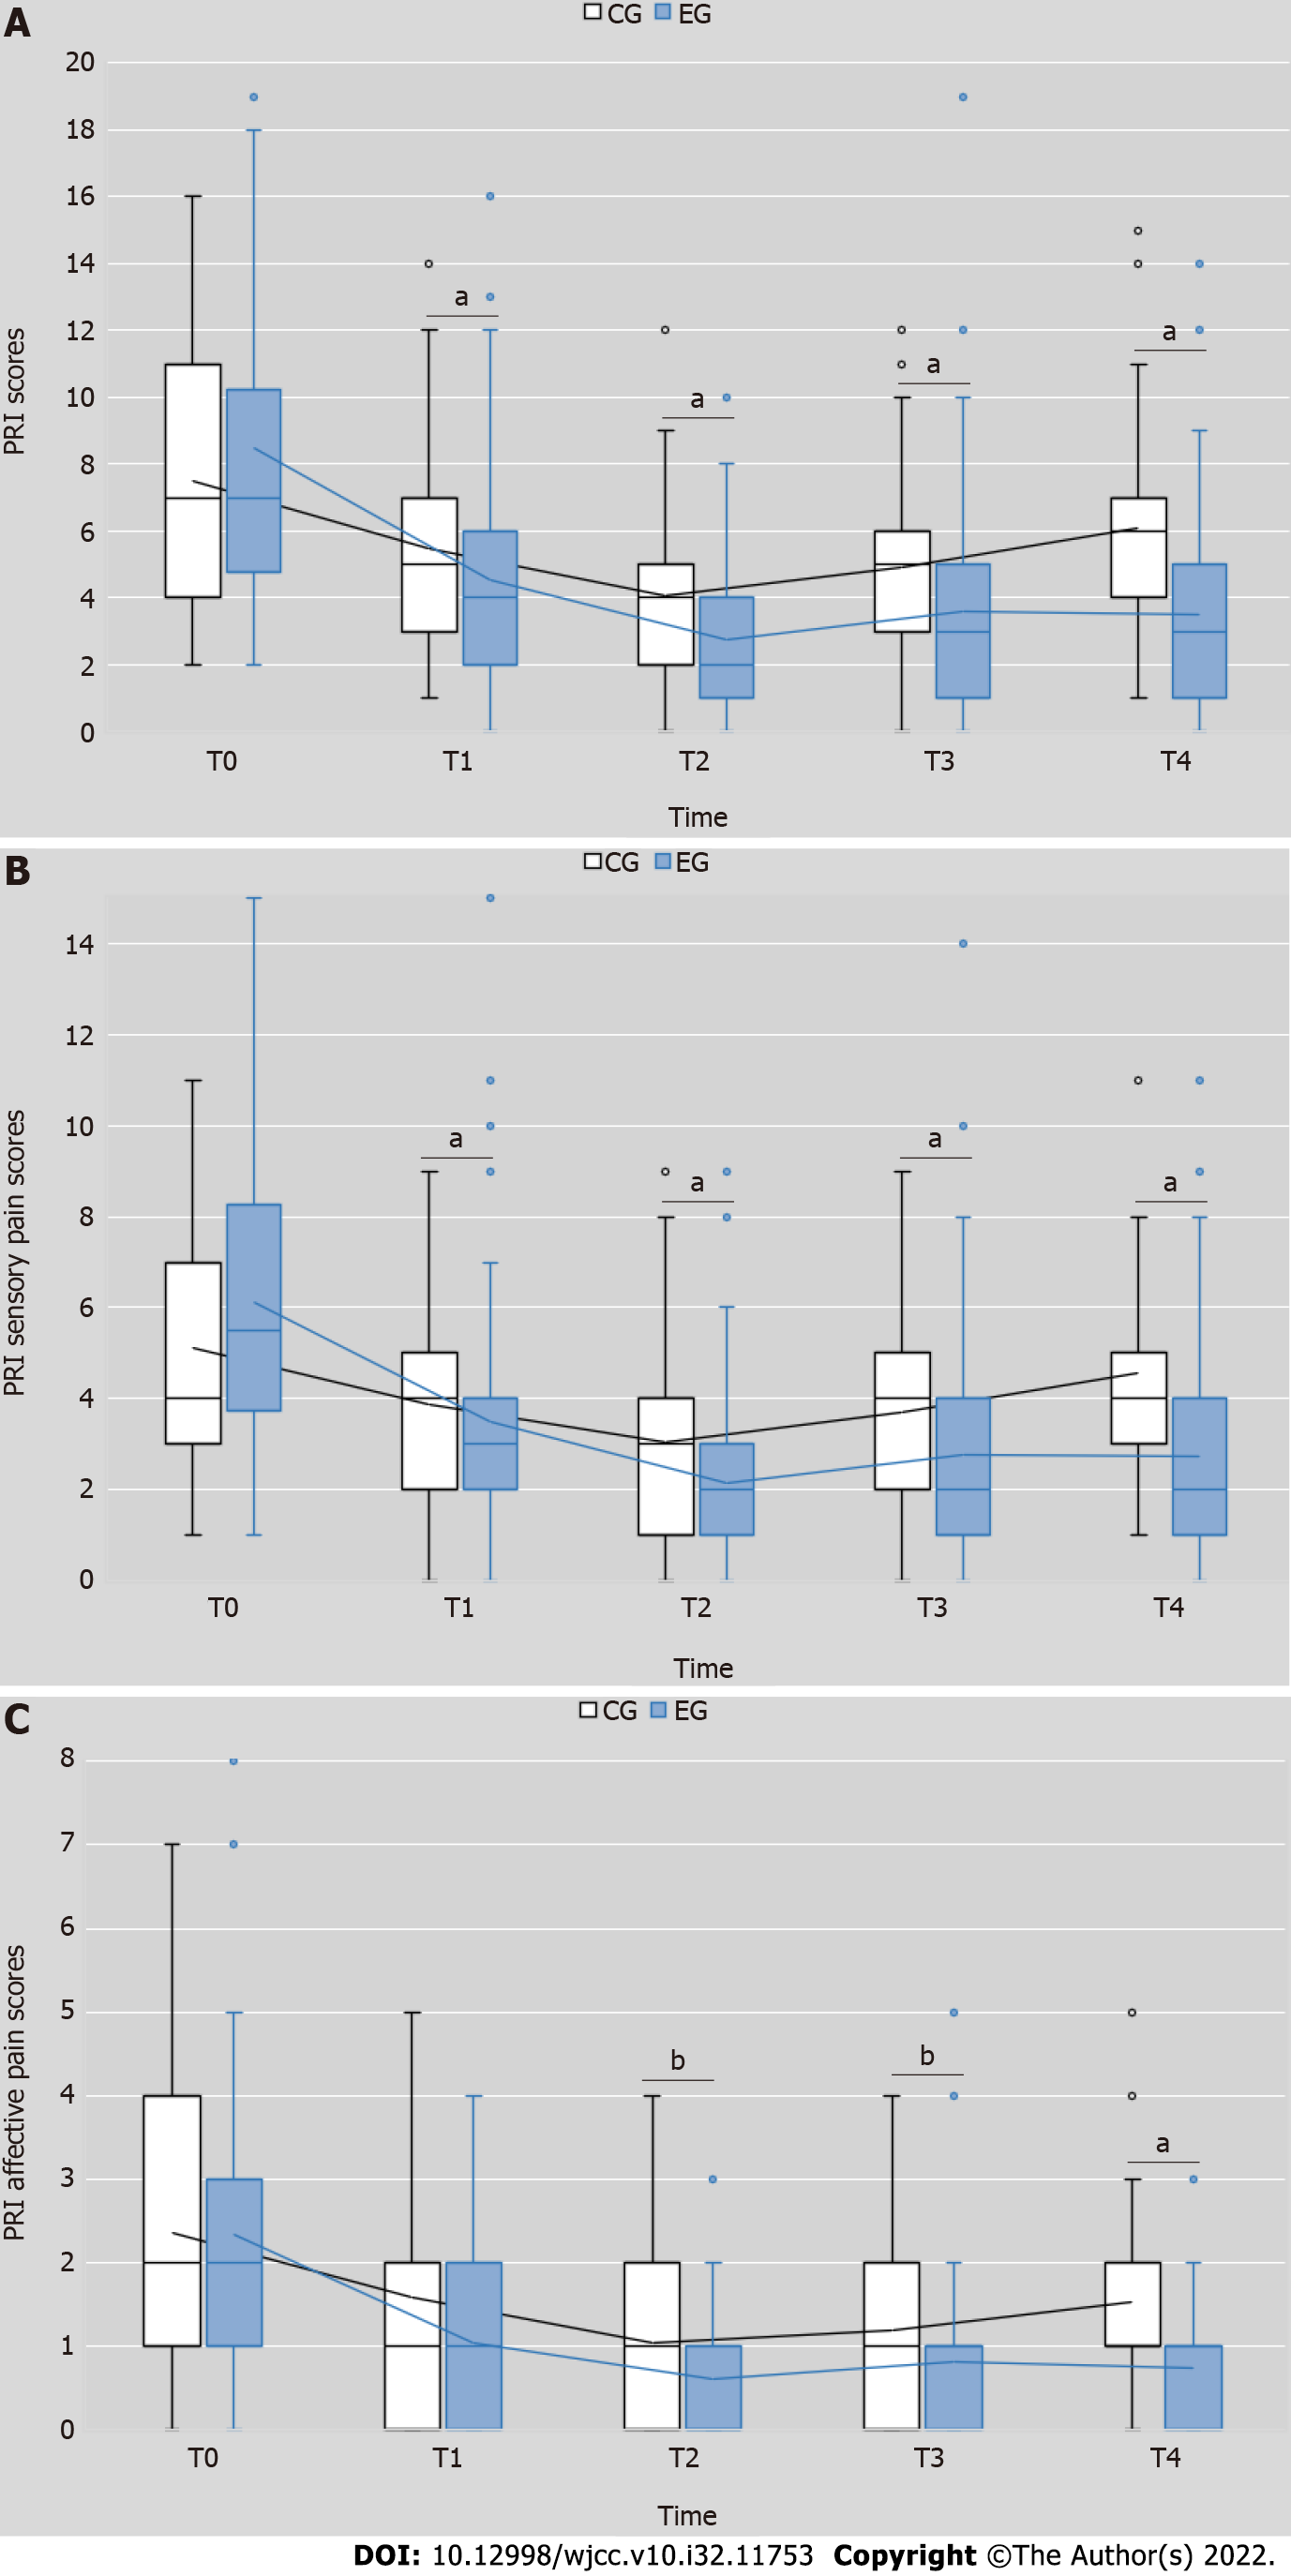
Figure 3 Changes in the pain rating index, sensory pain and affective pain.
A: Pain rating index (PRI) scores; B: PRI sensory pain scores; C: PRI affective pain scores. T0 = pretest, T1 = end of the first week after receiving treatment, T2 = end of the second week after receiving treatment, T3 = end of the first week after completing treatment, T4 = end of the fourth week after completing treatment. aP < 0.01, experimental group (EG) vs control group (CG); bP < 0.05, EG vs CG. CG: Control group; EG: Experimental group; PRI: Pain rating index.
- Citation: Xiao J, Cao BY, Xie Z, Ji YX, Zhao XL, Yang HJ, Zhuang W, Sun HH, Liang WM. Clinical efficacy of electromagnetic field therapy combined with traditional Chinese pain-reducing paste in myofascial pain syndrome. World J Clin Cases 2022; 10(32): 11753-11765
- URL: https://www.wjgnet.com/2307-8960/full/v10/i32/11753.htm
- DOI: https://dx.doi.org/10.12998/wjcc.v10.i32.11753


