Copyright
©The Author(s) 2022.
World J Clin Cases. Oct 26, 2022; 10(30): 11162-11171
Published online Oct 26, 2022. doi: 10.12998/wjcc.v10.i30.11162
Published online Oct 26, 2022. doi: 10.12998/wjcc.v10.i30.11162
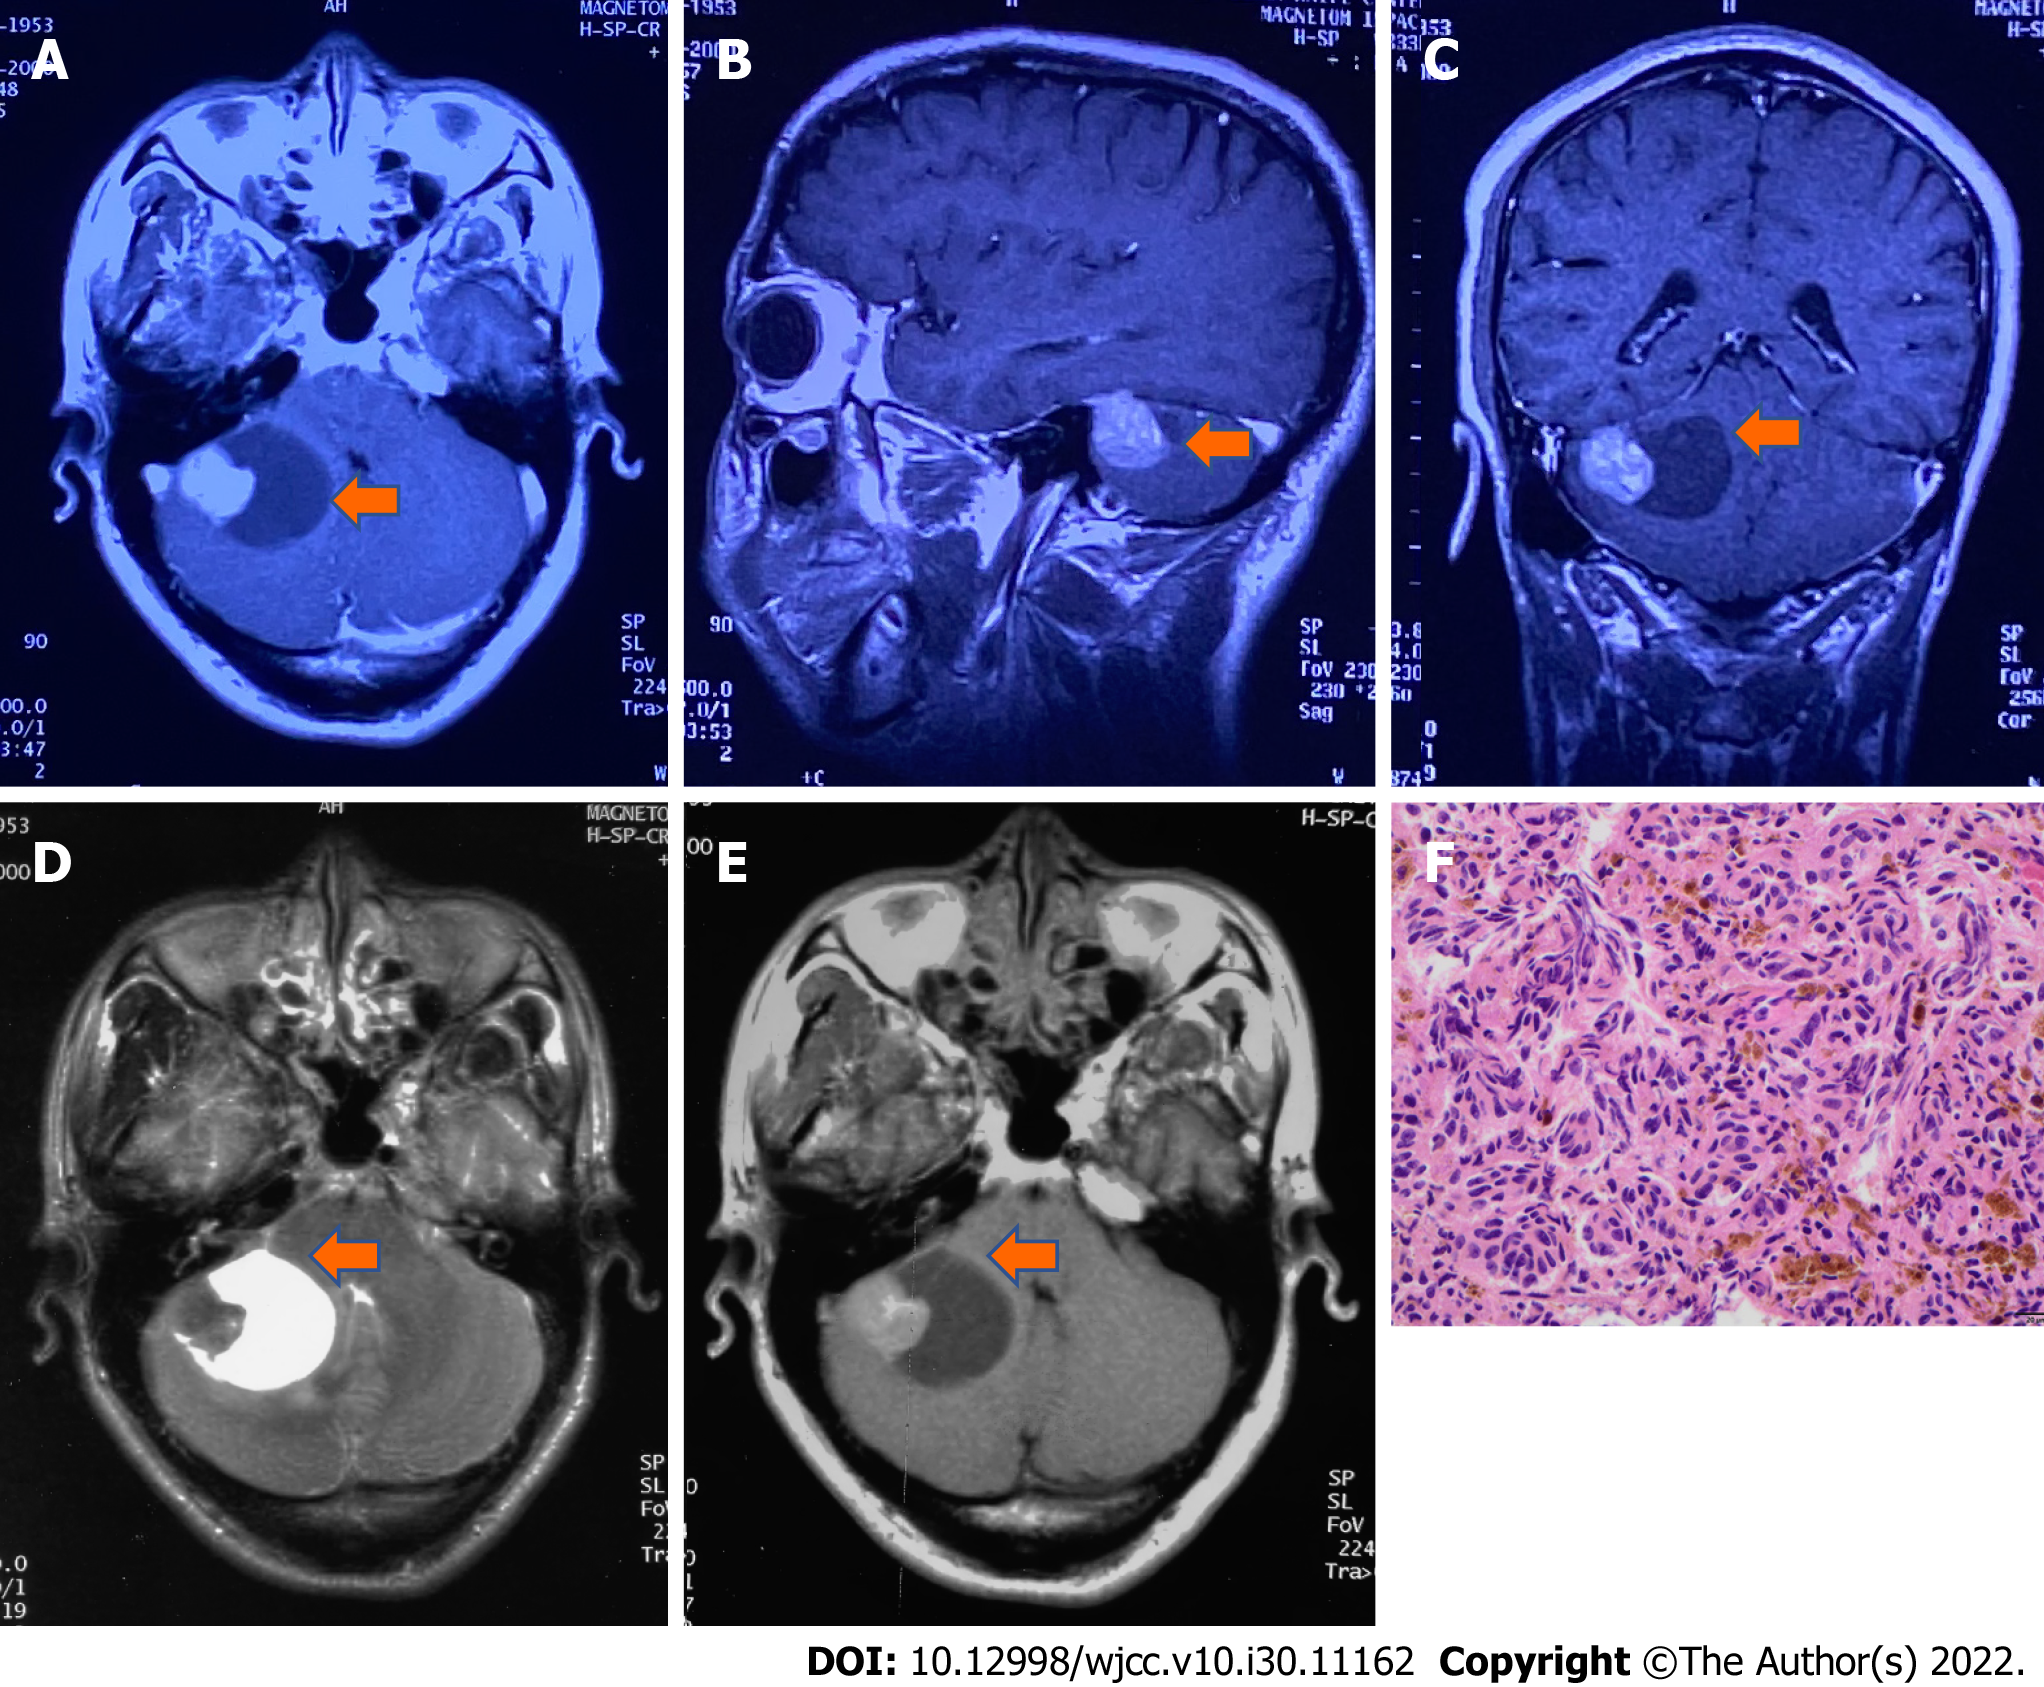
Figure 1 Magnetic resonance imaging and pathology at first recurrence.
A-C: Brain magnetic resonance imaging (MRI) T1-weighted postcontrast image (A) axial, (B) sagittal, (C) transverse,which indicates hyperintensity and intracapsular hypointense signals after contrast enhancement in the right cerebellopontine angle tumor (arrow); D and E: Axial MRI T2-weighted image shows a heterogeneous lightly hypointense node beside the hyperintense capsule, while axial MRI T1-weighted image (E) shows a heterogeneous lightly hyperintense node and hypointense capsule (October 24, 2000, before the 2nd operation); F: Histology shows recurrent melanoma (hematoxylin-eosin staining, magnification × 400).
Figure 2 Magnetic resonance imaging at second recurrence.
A-C: Brain magnetic resonance imaging (MRI) T1-weighted postcontrast image (A) axial, (B) transverse, (C) sagittal, which shows irregular soft tissue with heterogeneous hyperintense signals and subtle contrast enhancement in the right cerebellopontine angle cistern and annular cistern (arrow); D and E: Axial MRI T2-weighted imageshows isointensity, while axial MRI T1-weighted image (E) shows a hypointense mass with an unclear boundary with the right tentorium and brain stem compression (July 10, 2021, before the 3rd operation).
Figure 3 Surgical findings during the 3rd operation.
A: Surgical findings showed a dark black semisolid lesion (arrow) was seen under the petrosal vein, the facial nerve was pushed outward and upward, and the trochlear and trigeminal nerves were pressed forward and downward in the right temporal lobe close to the cerebellopontine angle; B: The tumor lesion.
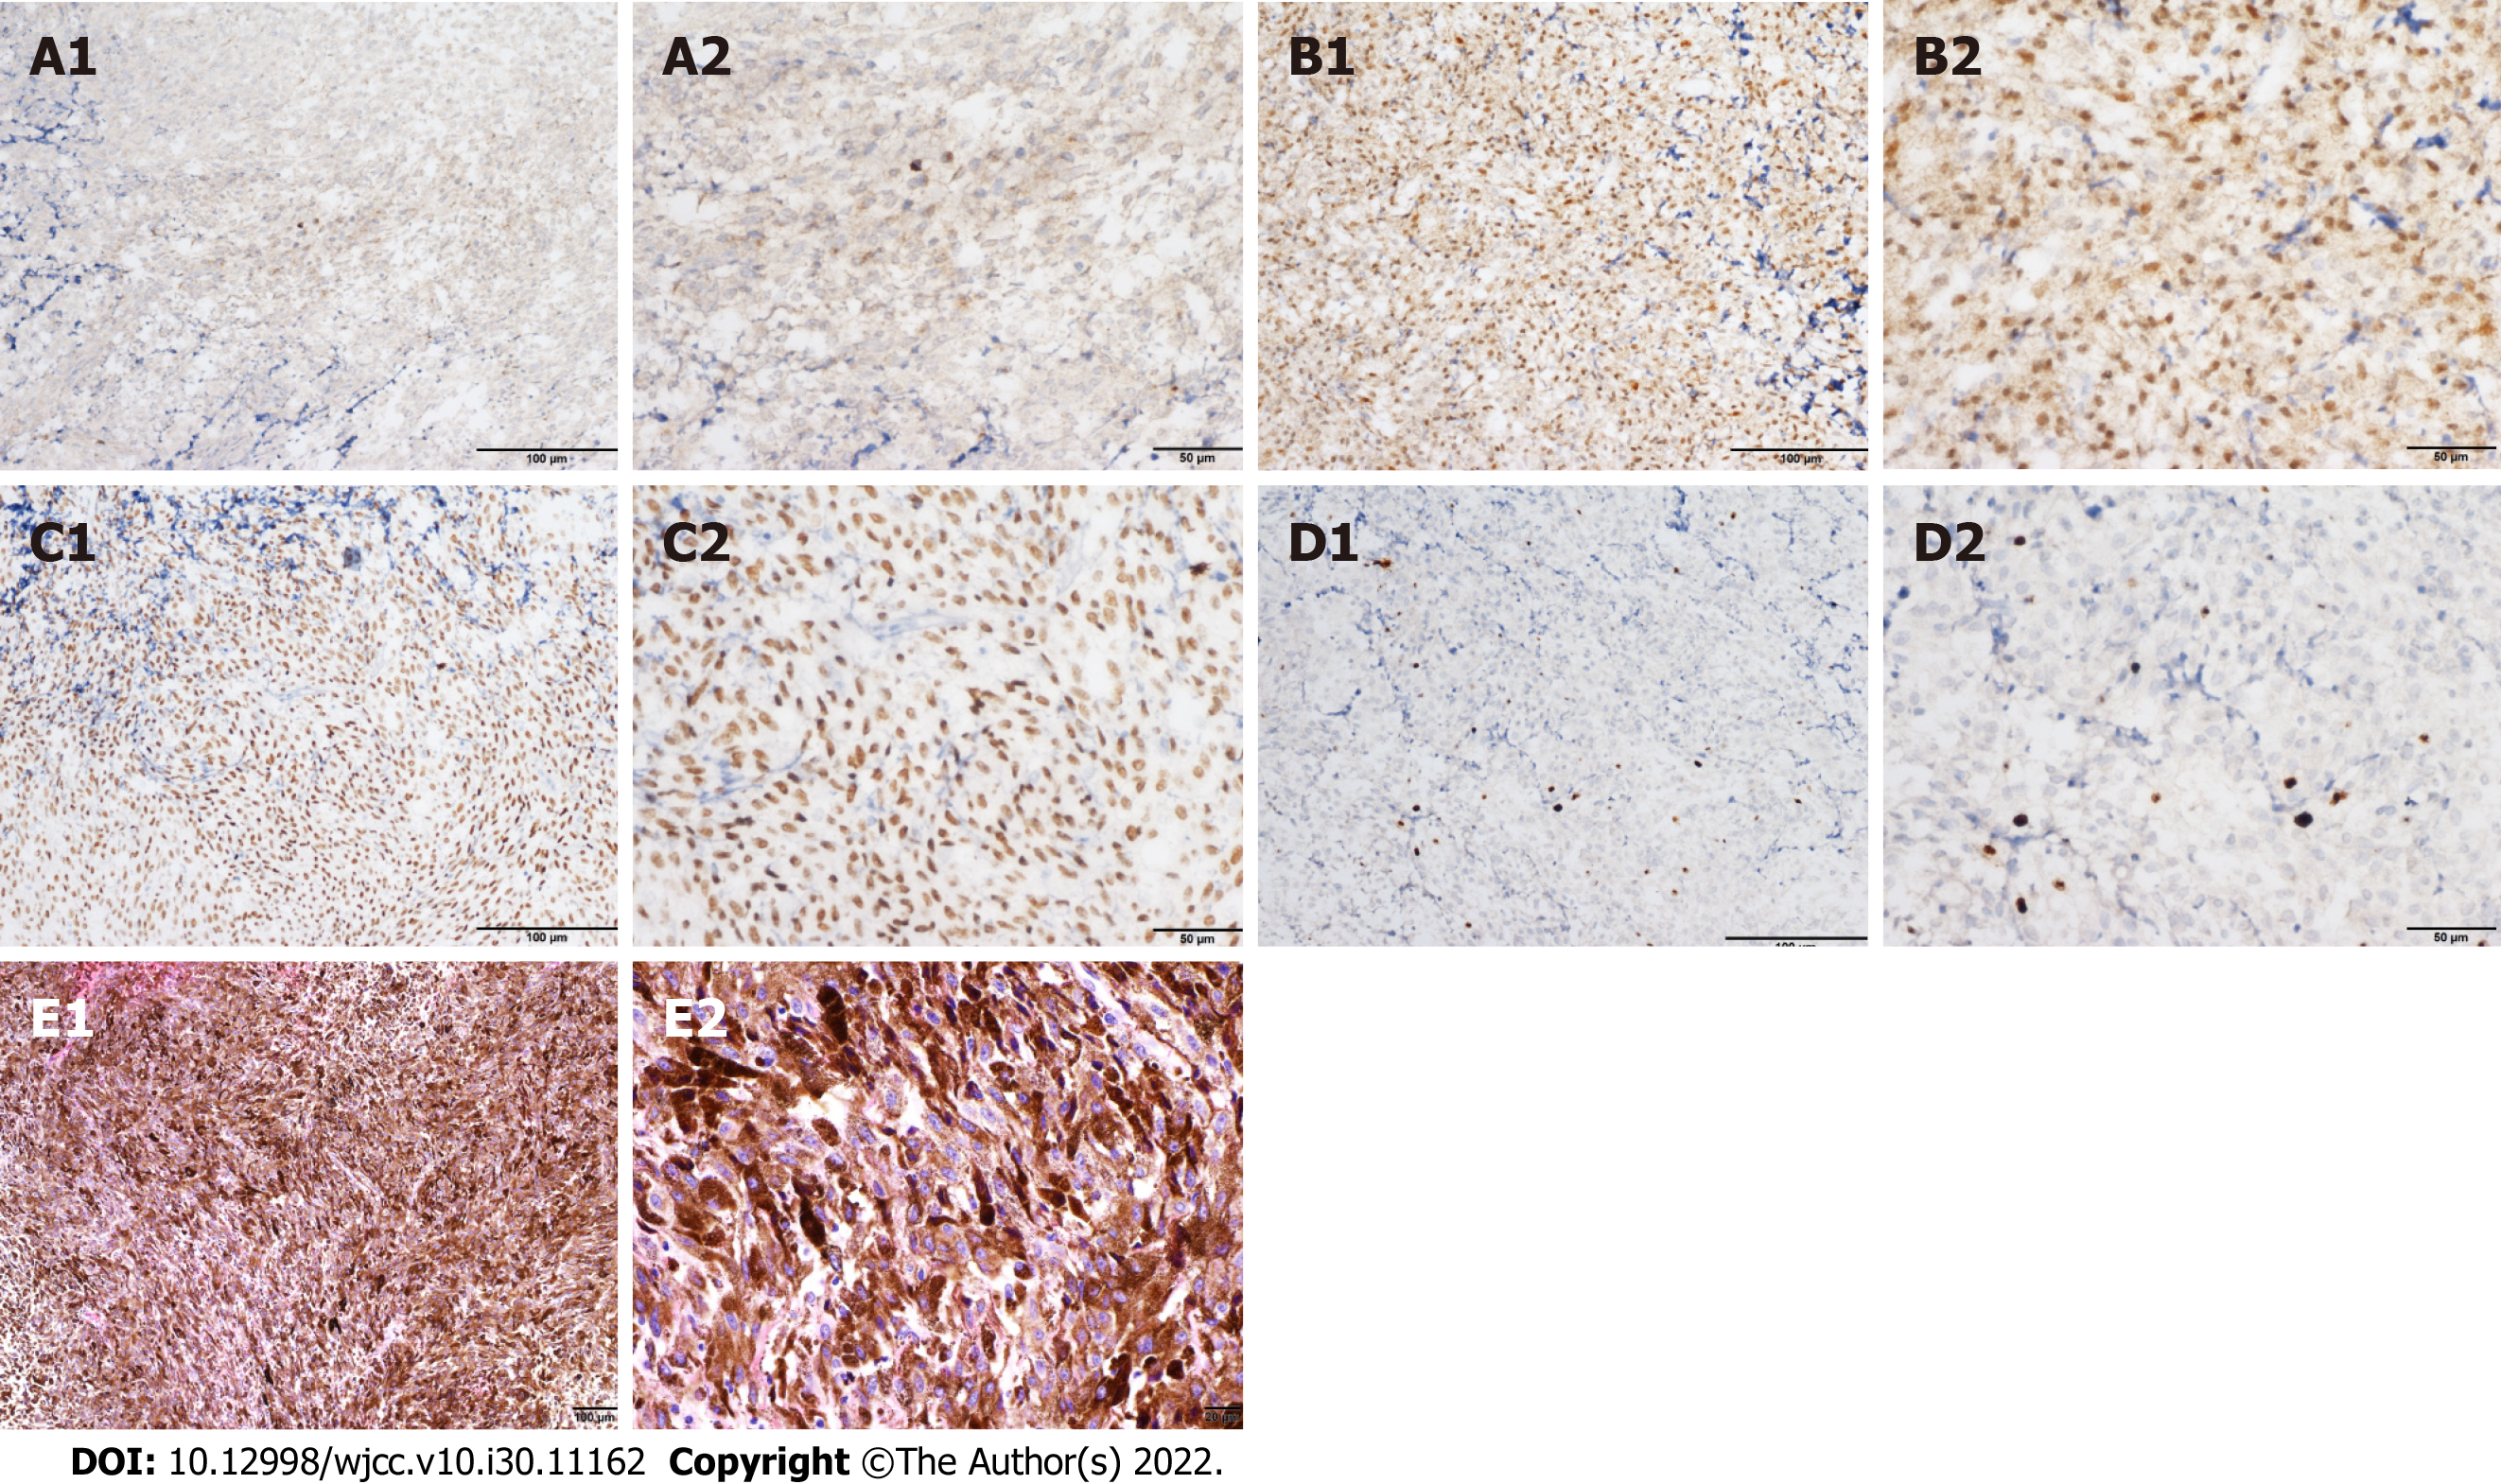
Figure 4 Immunohistochemical and histopathological analysis of confirmed recurrent melanoma at the 3rd operation.
A-D: Immunohistochemical staining of tumor cells showed positivity for (A) HMB-45, (B) S-100, (C) SOX-10, and (D) Ki67 (8%) (A1, B1, C1, and D1: × 200; A2, B2, C2, and D2: × 400); E: Hematoxylin-eosin staining showed that the tumor cells were diffusely distributed in flakes, with abundant cytoplasm, pigment granules in some cells, round or oval nuclei, nucleoli, and mitotic figures (3 cells/10 high power fields) (E1: × 100; E2: × 400).
Figure 5 Magnetic resonance imaging at last follow-up.
A-C: Brain magnetic resonance imaging (MRI) T1-weighted postcontrast image (A) axial, (B) sagittal, (C) transverse; D: Axial MRI T2-weighted image show that no residual tumor or recurrence was found in the right cerebellopontine angle 3 mo after the operation.
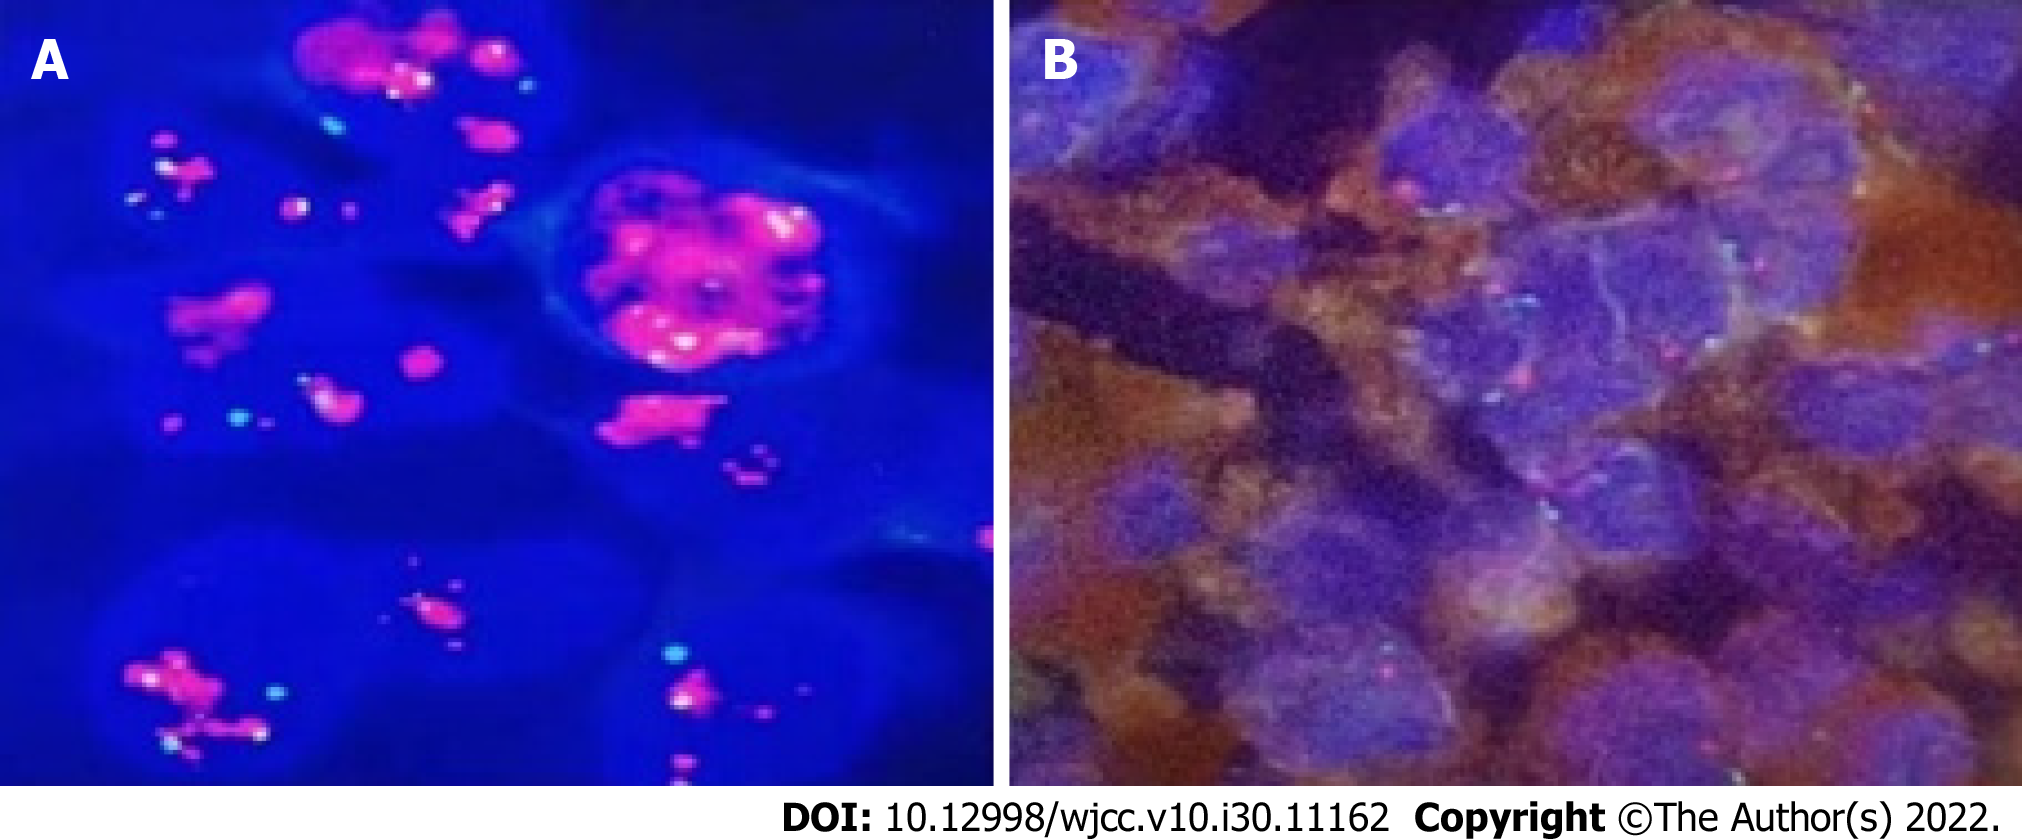
Figure 6 MDM2 gene amplification test.
A: Positive control; B: Test sample showed negative result of FISH test.
- Citation: Wong TF, Chen YS, Zhang XH, Hu WM, Zhang XS, Lv YC, Huang DC, Deng ML, Chen ZP. Longest survival with primary intracranial malignant melanoma: A case report and literature review. World J Clin Cases 2022; 10(30): 11162-11171
- URL: https://www.wjgnet.com/2307-8960/full/v10/i30/11162.htm
- DOI: https://dx.doi.org/10.12998/wjcc.v10.i30.11162


