Copyright
©The Author(s) 2022.
World J Clin Cases. Jun 16, 2022; 10(17): 5586-5594
Published online Jun 16, 2022. doi: 10.12998/wjcc.v10.i17.5586
Published online Jun 16, 2022. doi: 10.12998/wjcc.v10.i17.5586
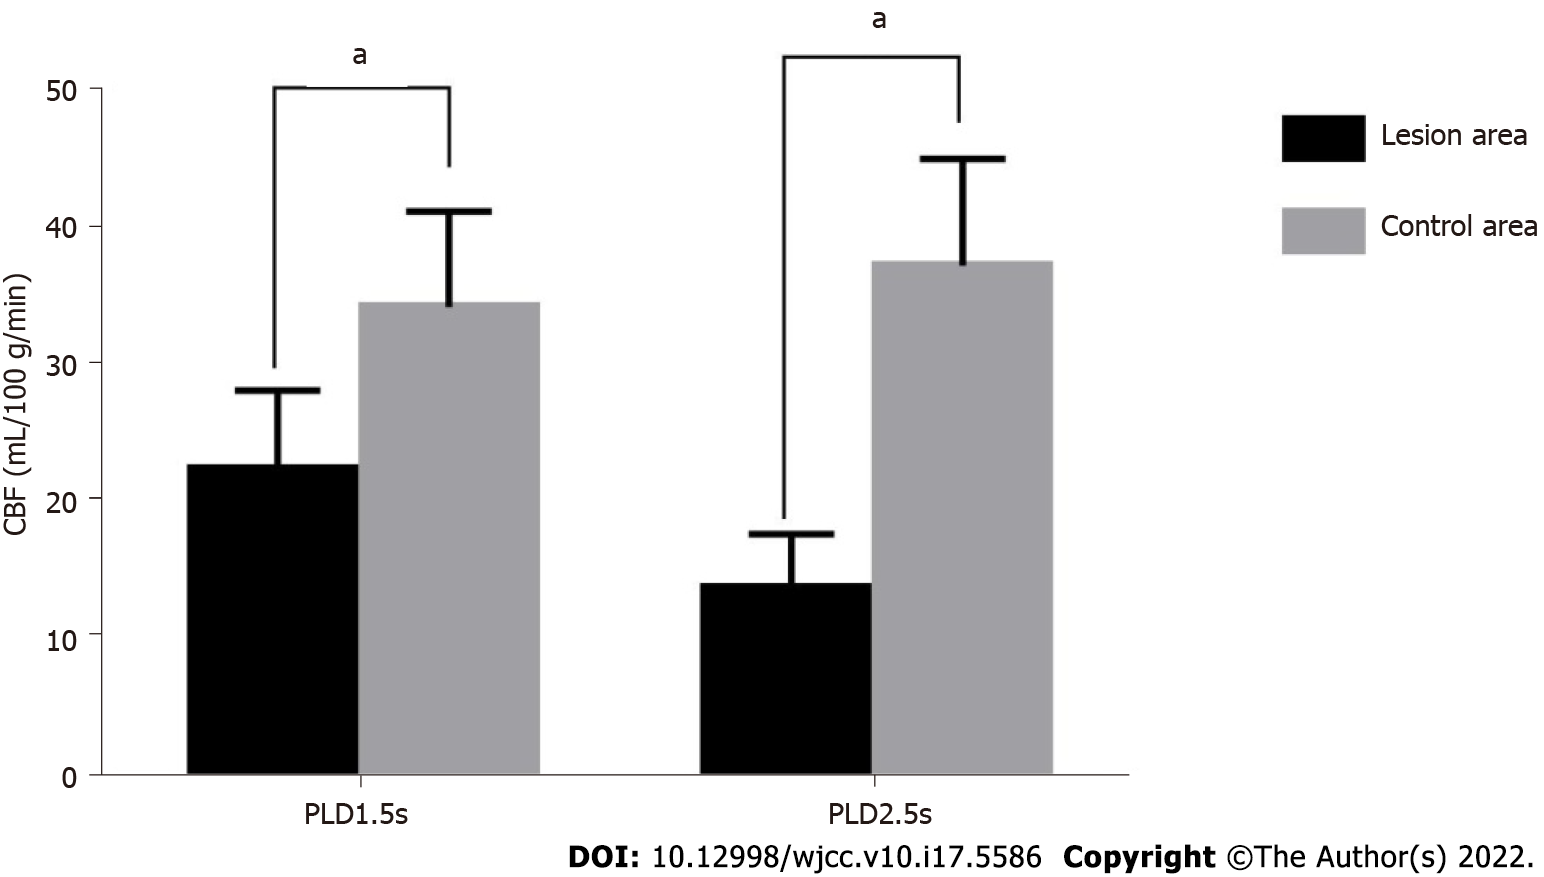
Figure 1 Histogram of cerebral blood flow values of the lesion and control areas under parameters of different delay time after labeling 1.
5 s and 2.5 s. aP < 0.05 vs control areas. CBF: Cerebral blood flow; PLD: Parameters of different delay time.
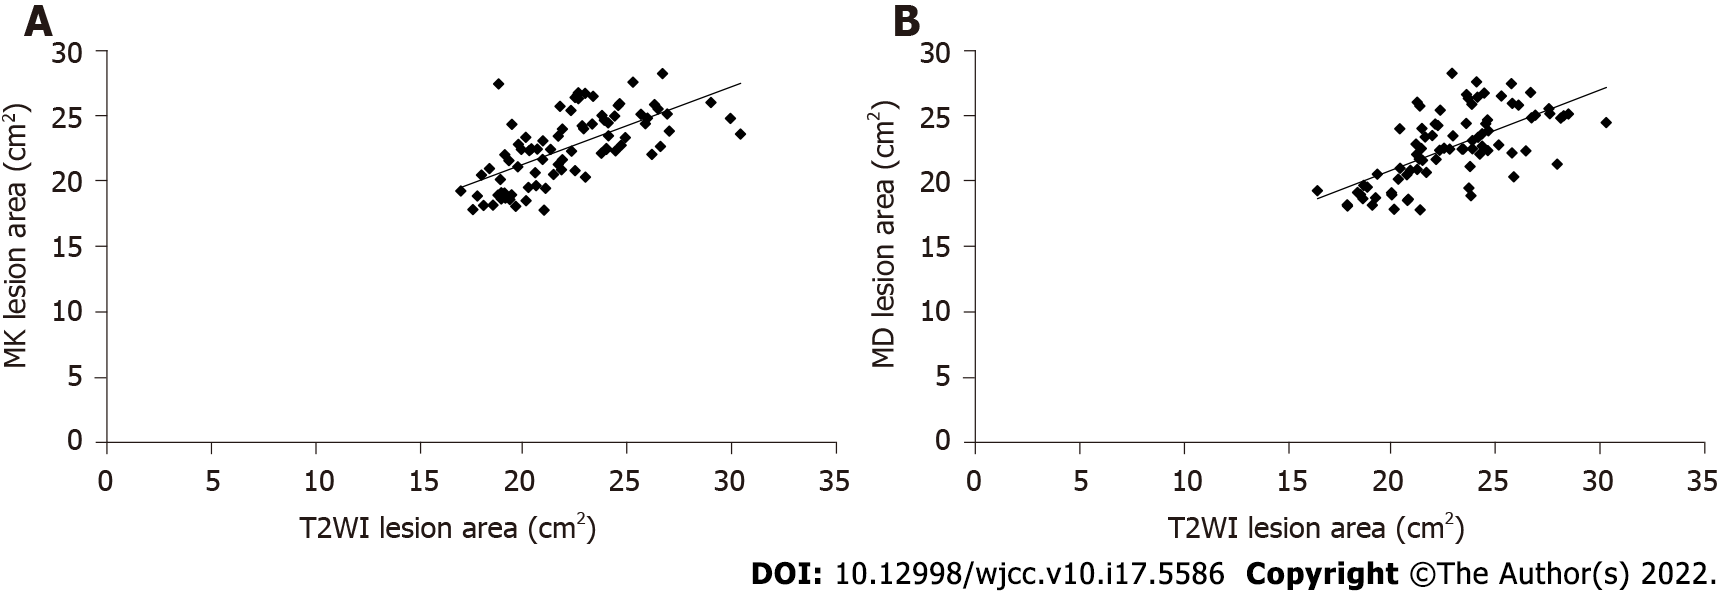
Figure 2 Correlation between the average kurtosis, the average diffusion coefficient, and the area of cerebral infarction on T2-weighted imaging.
A: Correlation between the average kurtosis and the area of cerebral infarction; B: Correlation between the average diffusion coefficient and the area of cerebral infarction. MD: Average diffusion coefficient; MK: Average kurtosis; T2WI: T2-weighted imaging.
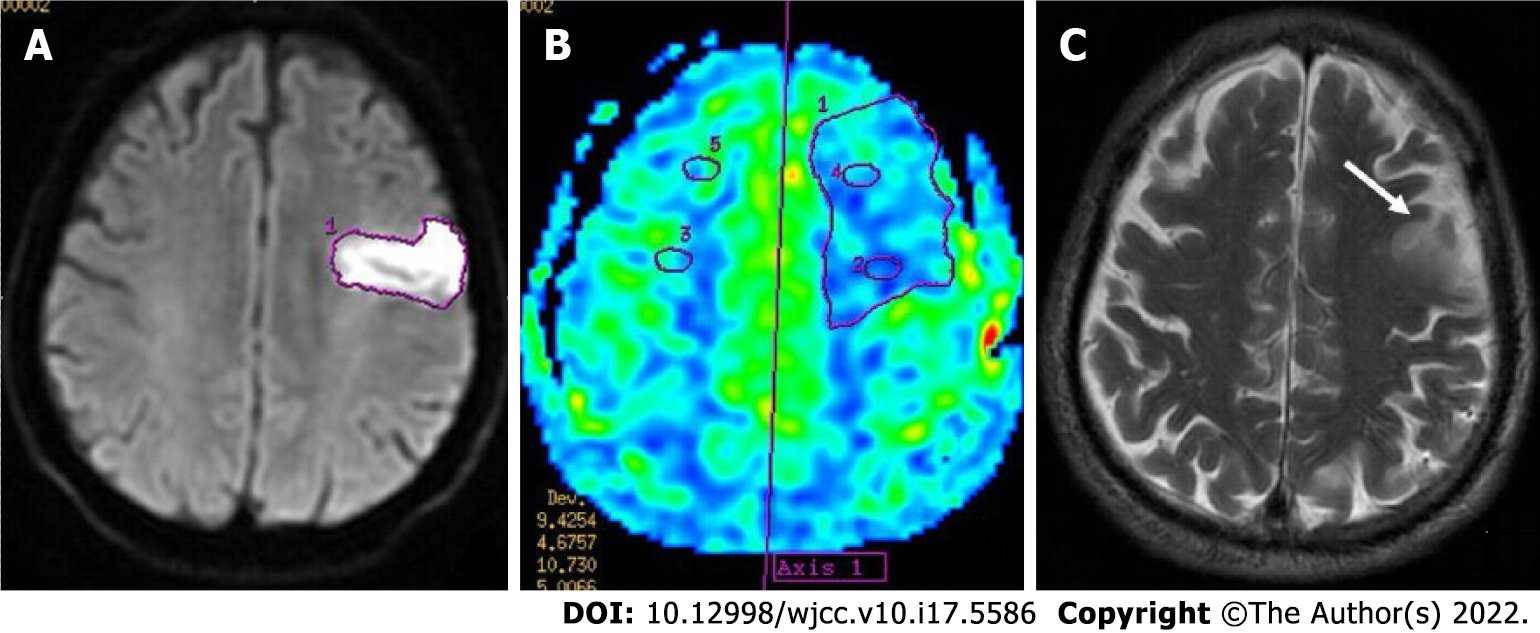
Figure 3 A 67-year-old male patient was admitted to the hospital due to dizziness, vomiting, and limb dysfunction for 12 h.
Magnetic resonance imaging examination was performed within 4 h after admission, and the patient was diagnosed with acute cerebral infarction in the left frontal lobe. A: The diffusion-weighted imaging image and the focal area of cerebral infarction showing high signal performance; B: The color map of cerebral perfusion, showing significant hypoperfusion in the infarct lesion area; C: T2-weighted imaging, with the infarct area indicated by the white arrow showing high signal intensity (Arrow).
- Citation: Jiang YY, Zhong ZL, Zuo M. Three-dimensional arterial spin labeling and diffusion kurtosis imaging in evaluating perfusion and infarct area size in acute cerebral ischemia. World J Clin Cases 2022; 10(17): 5586-5594
- URL: https://www.wjgnet.com/2307-8960/full/v10/i17/5586.htm
- DOI: https://dx.doi.org/10.12998/wjcc.v10.i17.5586


