Copyright
©The Author(s) 2016.
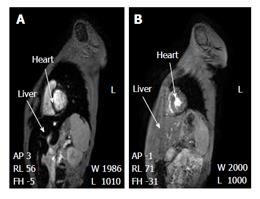
Figure 4 Non homogeneous iron distribution among the organs of iron loaded thalassaemia patients.
Differential iron loading of the heart and liver of two iron loaded thalassaemia patients using MRI and T2* estimation. A: Heavy haemosiderosis of the liver [T2* = 1.2 ms (normal T2* ≥ 6.3)] and normal T2* of the heart (T2* = 20.6). The top arrow shows the interventricular septum of the heart of the patient with no iron deposition (normal) where the bottom arrow shows the heavy iron loading within the liver parenchyma, demonstrated as low signal intensity (dark); B: Heavy haemosiderosis of the heart (T2* = 6.32 ms) and normal T2* of the liver (T2* = 19.2 ms). The top arrow shows the abnormal iron deposition in the interventricular septum of the heart of the patient, which is shown with low signal intensity (dark). The bottom arrow shows the liver of the patient with no iron deposition (normal). Adapted from ref. [14]. MRI: Magnetic resonance imaging.
- Citation: Kontoghiorghe CN, Kontoghiorghes GJ. New developments and controversies in iron metabolism and iron chelation therapy. World J Methodol 2016; 6(1): 1-19
- URL: https://www.wjgnet.com/2222-0682/full/v6/i1/1.htm
- DOI: https://dx.doi.org/10.5662/wjm.v6.i1.1


