Copyright
©2013 Baishideng Publishing Group Co.
World J Methodol. Jun 26, 2013; 3(2): 19-26
Published online Jun 26, 2013. doi: 10.5662/wjm.v3.i2.19
Published online Jun 26, 2013. doi: 10.5662/wjm.v3.i2.19
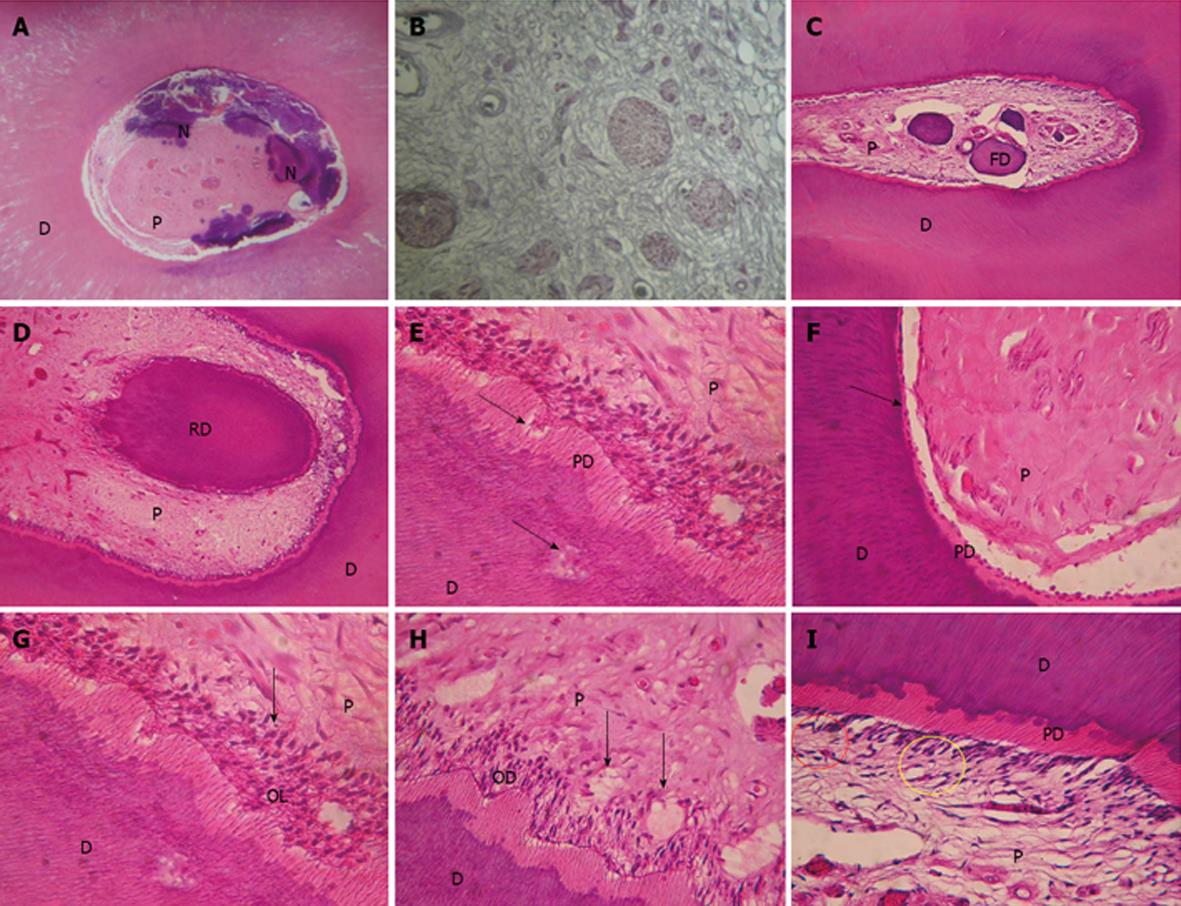
Figure 1 Photography.
A: Showing necrotic areas in a slice of the group treated with orthodontics without laser (magnification × 10); B: Showing increased nerve density in the pulp of a laser irradiated specimen (magnification × 40); C: A control group premolar that shows a false denticle - denticle without epithelium (magnification × 10); D: A premolar from G3 group presenting a real denticle - with epithelium (magnification × 10); E: The arrows signal dentin and predentin sclerosis in a G2 specimen (magnification × 20); F: The arrows indicate focal predentin lost in a G1 premolar (magnification × 20); G: Irregularities in odontoblast layer. The thickness of odontoblast layer is indicated with the arrow in this G2 premolar slice (magnification × 20); H: The arrows indicate the presence of odontoblast vacuolization in a specimen treated both with orthodontics and laser (magnification × 20); I: The red circle shows a normal Weil cell-free zone and the yellow circle marks a zone invaded by cells and blood vessels in a G4 premolar (magnification × 20). D: Dentine; P: Pulp; N: Necrosis; FD: False denticle; RD: Real denticle; PD: Predentin; OL: Odontoblast layer.
- Citation: Domínguez &, Ballesteros RE, Viáfara JH, Tamayo OM. Effect of low level laser therapy on dental pulp during orthodontic movement. World J Methodol 2013; 3(2): 19-26
- URL: https://www.wjgnet.com/2222-0682/full/v3/i2/19.htm
- DOI: https://dx.doi.org/10.5662/wjm.v3.i2.19


