















Copyright: ©Author(s) 2026.
World J Methodol. Jun 20, 2026; 16(2): 117099
Published online Jun 20, 2026. doi: 10.5662/wjm.v16.i2.117099
Published online Jun 20, 2026. doi: 10.5662/wjm.v16.i2.117099
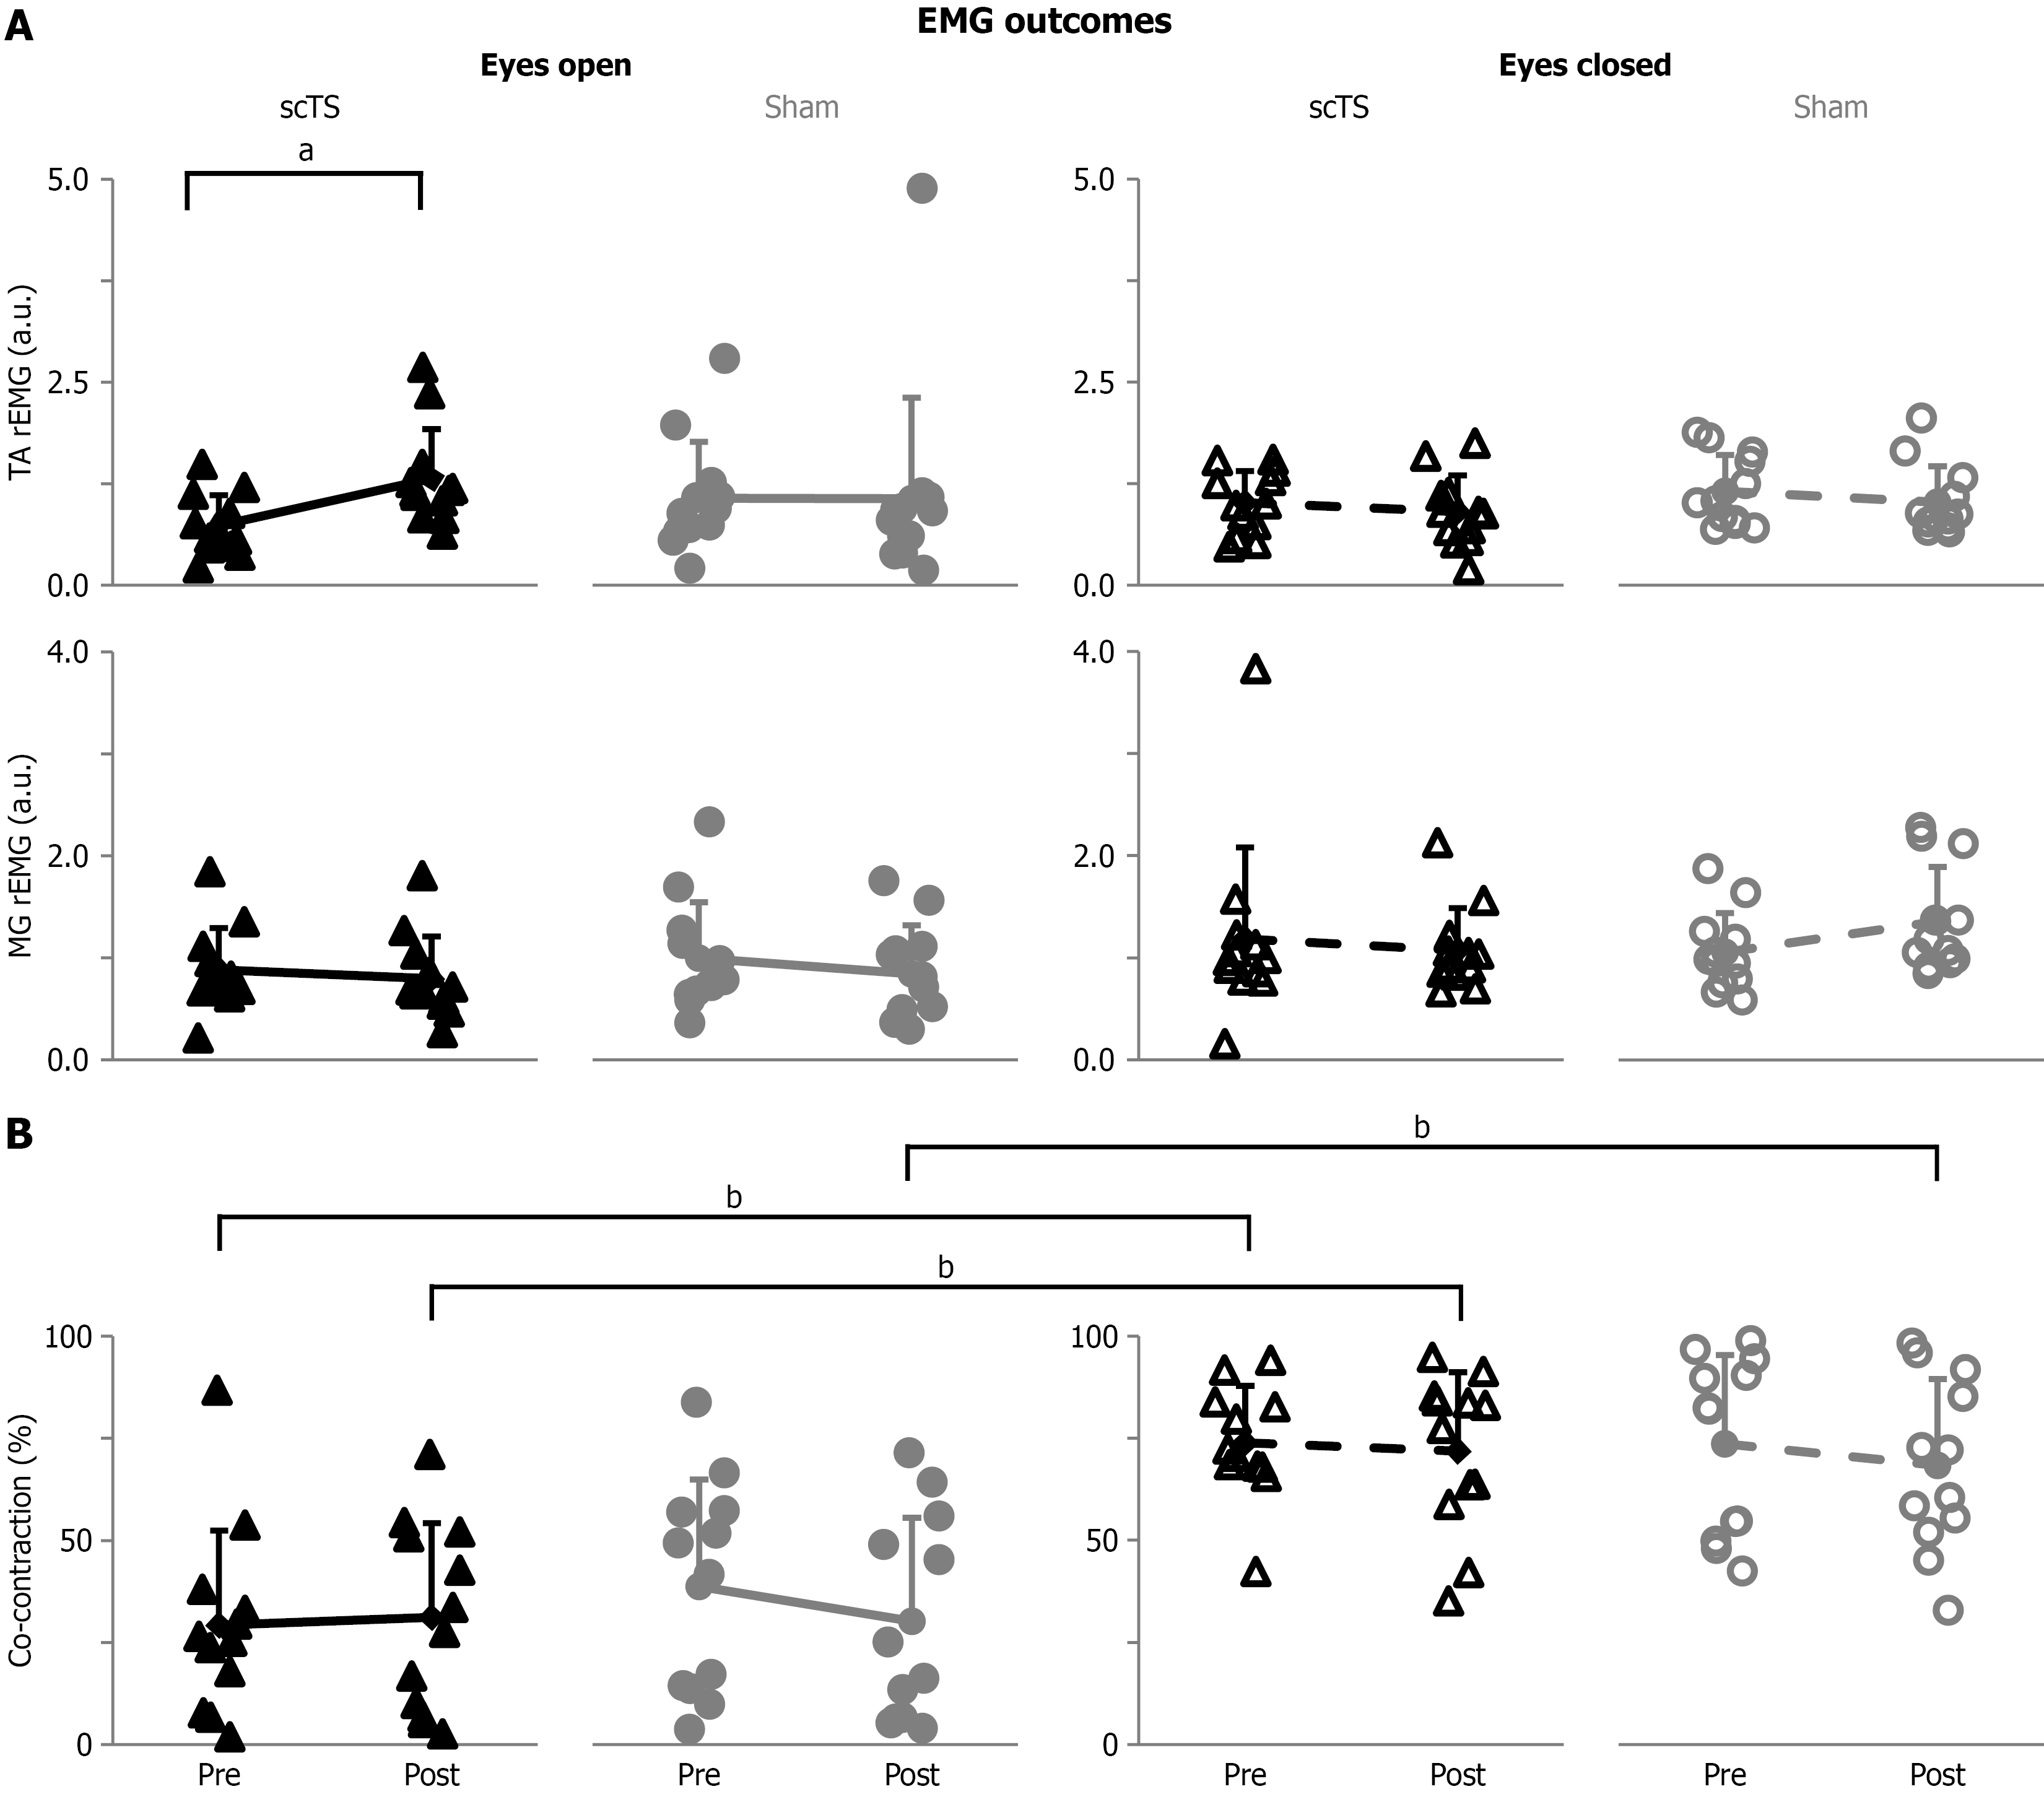
Figure 4 Group data of electromyographic activity.
A: Ratio of electromyography (EMG) amplitude assessed at the end of each trial by the EMG amplitude detected at the start of the trial for the tibialis anterior (P < 0.05) and medial gastrocnemius (P < 0.01). Ratio of EMG are expressed in arbitrary units; B: Single-leg stance duration in which tibialis anterior and medial gastrocnemius muscles were active at the same time above their respective 10% maximal voluntary contraction (co-contraction; P < 0.001). Both metrics are reported for the single-leg stance attempts with eyes open and eyes closed, before and after the priming protocol with spinal cord transcutaneous (scTS) or sham stimulation (sham). Results are described as individual data points (solid black triangles: ScTS, eyes open; solid grey circles: Sham, eyes open; empty black triangles: ScTS, eyes closed; empty grey circles: Sham, eyes closed) as well as mean and standard deviation. Significant difference by Bonferroni post hoc test: aP < 0.05; bP < 0.01. EMG: Electromyographic; scTS: Spinal cord transcutaneous stimulation; Sham: Sham stimulation; TA: Tibialis anterior; MG: Medial gastrocnemius; a.u.: Arbitrary unit; rEMG: Ratio of electromyography.
- Citation: Zaccaron S, D’Alleva M, Mari L, Stafuzza J, Lazzer S, Rejc E. Effects of spinal cord transcutaneous stimulation priming on single-leg balance control. World J Methodol 2026; 16(2): 117099
- URL: https://www.wjgnet.com/2222-0682/full/v16/i2/117099.htm
- DOI: https://dx.doi.org/10.5662/wjm.v16.i2.117099