
















©The Author(s) 2026.
World J Methodol. Mar 20, 2026; 16(1): 109733
Published online Mar 20, 2026. doi: 10.5662/wjm.v16.i1.109733
Published online Mar 20, 2026. doi: 10.5662/wjm.v16.i1.109733
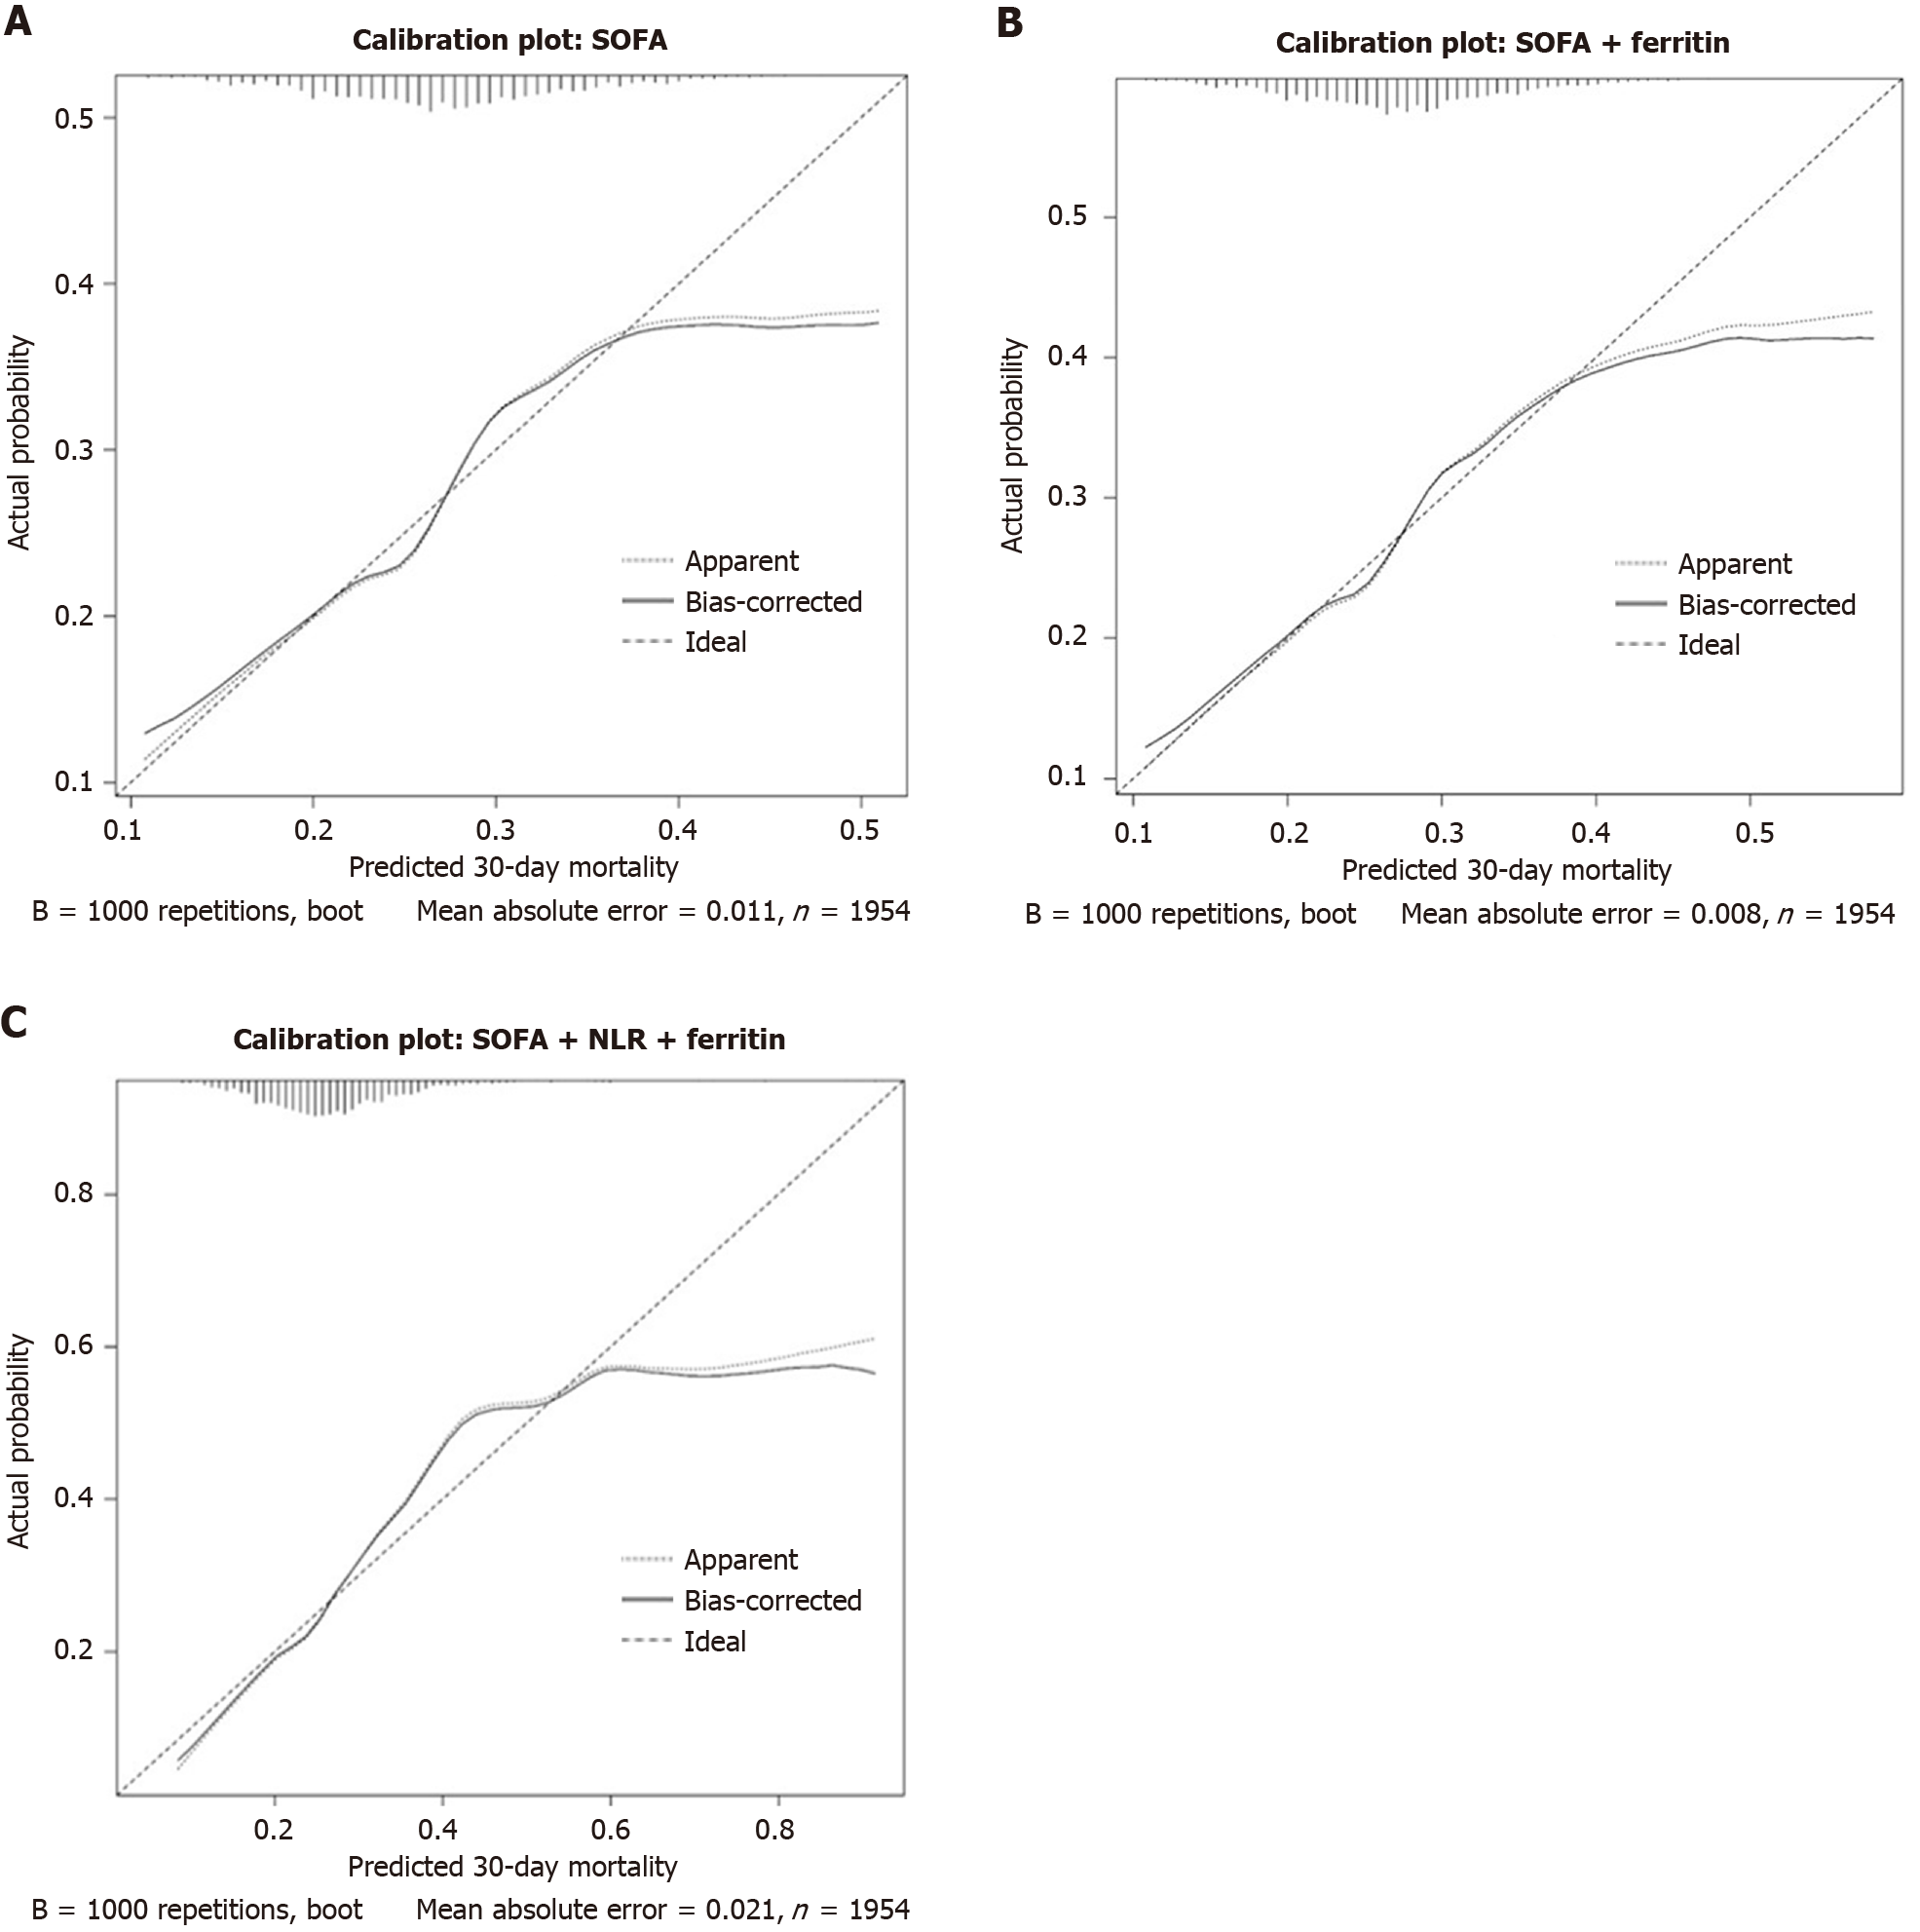
Figure 4 Calibration plot for Sequential Organ Failure Assessment model, Sequential Organ Failure Assessment plus ferritin model, and Sequential Organ Failure Assessment plus neutrophil-to-lymphocyte ratio plus ferritin model.
A: This figure indicates that calibration is near the ideal line with mean absolute error of 0.011 in a cohort of 1.954 patients with 1000 resamples; B: This figure indicates that calibration is near the ideal line with mean absolute error of 0.008 in a cohort of 1.954 patients with 1000 resamples; C: This figure indicates that calibration is near the ideal line but slightly deviated in high-risk patients with mean absolute error of 0.021 in a cohort of 1.954 patients with 1000 resamples. NLR: Neutrophil-to-lymphocyte ratio; SOFA: Sequential Organ Failure Assessment.
- Citation: Patel N, Patel V, Murugan Y, Patel K, Varma V, Surani S. Integrating serum ferritin and neutrophil-to-lymphocyte ratio with Sequential Organ Failure Assessment score improves mortality prediction in sepsis. World J Methodol 2026; 16(1): 109733
- URL: https://www.wjgnet.com/2222-0682/full/v16/i1/109733.htm
- DOI: https://dx.doi.org/10.5662/wjm.v16.i1.109733