
















©The Author(s) 2026.
World J Methodol. Mar 20, 2026; 16(1): 107927
Published online Mar 20, 2026. doi: 10.5662/wjm.v16.i1.107927
Published online Mar 20, 2026. doi: 10.5662/wjm.v16.i1.107927
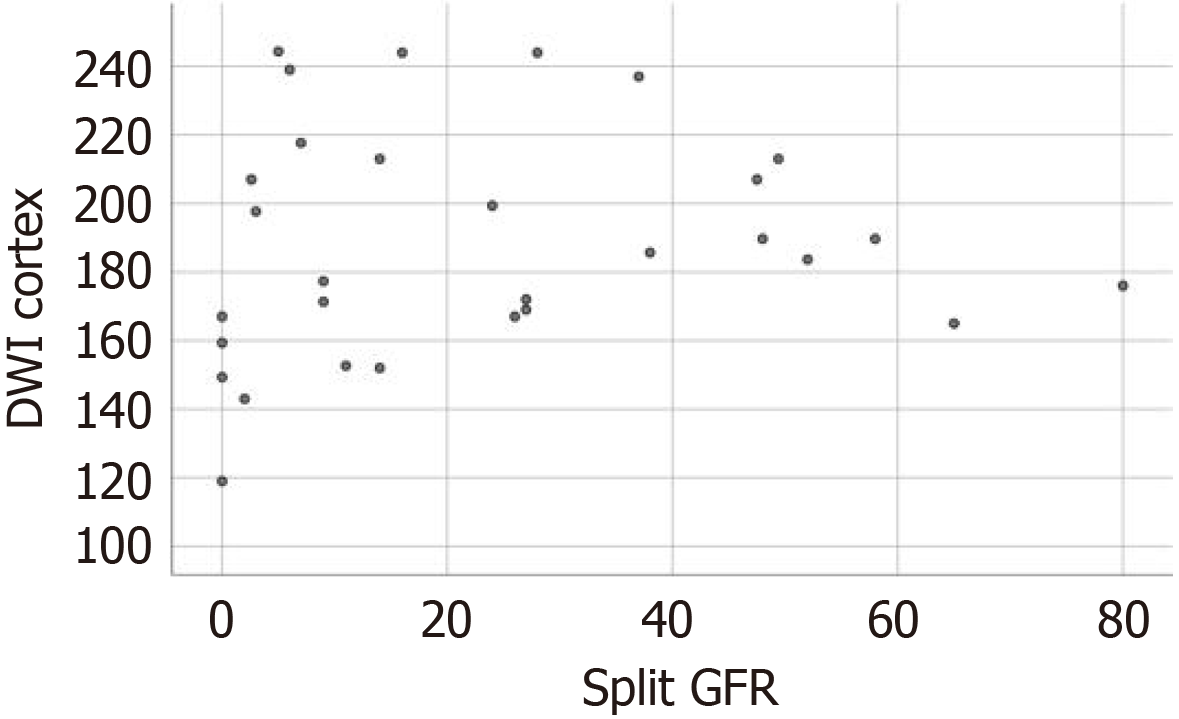
Figure 7 Scatter plot representing the relationship between renal apparent diffusion coefficient values (× 10-3 mm2/s) and the split GFR (mL/minute).
GFR: Glomerular filtration rate.
- Citation: Lal H, Agarwal S, Ponmalai K, Prasad R, Bhadauria DS, Gambhir S, Mandal S, Kumar S, Yadav P, Jowel P. Apparent diffusion coefficient of kidneys with non-contrast magnetic resonance angiography for functional and anatomical assessment in renal artery stenosis. World J Methodol 2026; 16(1): 107927
- URL: https://www.wjgnet.com/2222-0682/full/v16/i1/107927.htm
- DOI: https://dx.doi.org/10.5662/wjm.v16.i1.107927