
















©The Author(s) 2026.
World J Methodol. Mar 20, 2026; 16(1): 107927
Published online Mar 20, 2026. doi: 10.5662/wjm.v16.i1.107927
Published online Mar 20, 2026. doi: 10.5662/wjm.v16.i1.107927
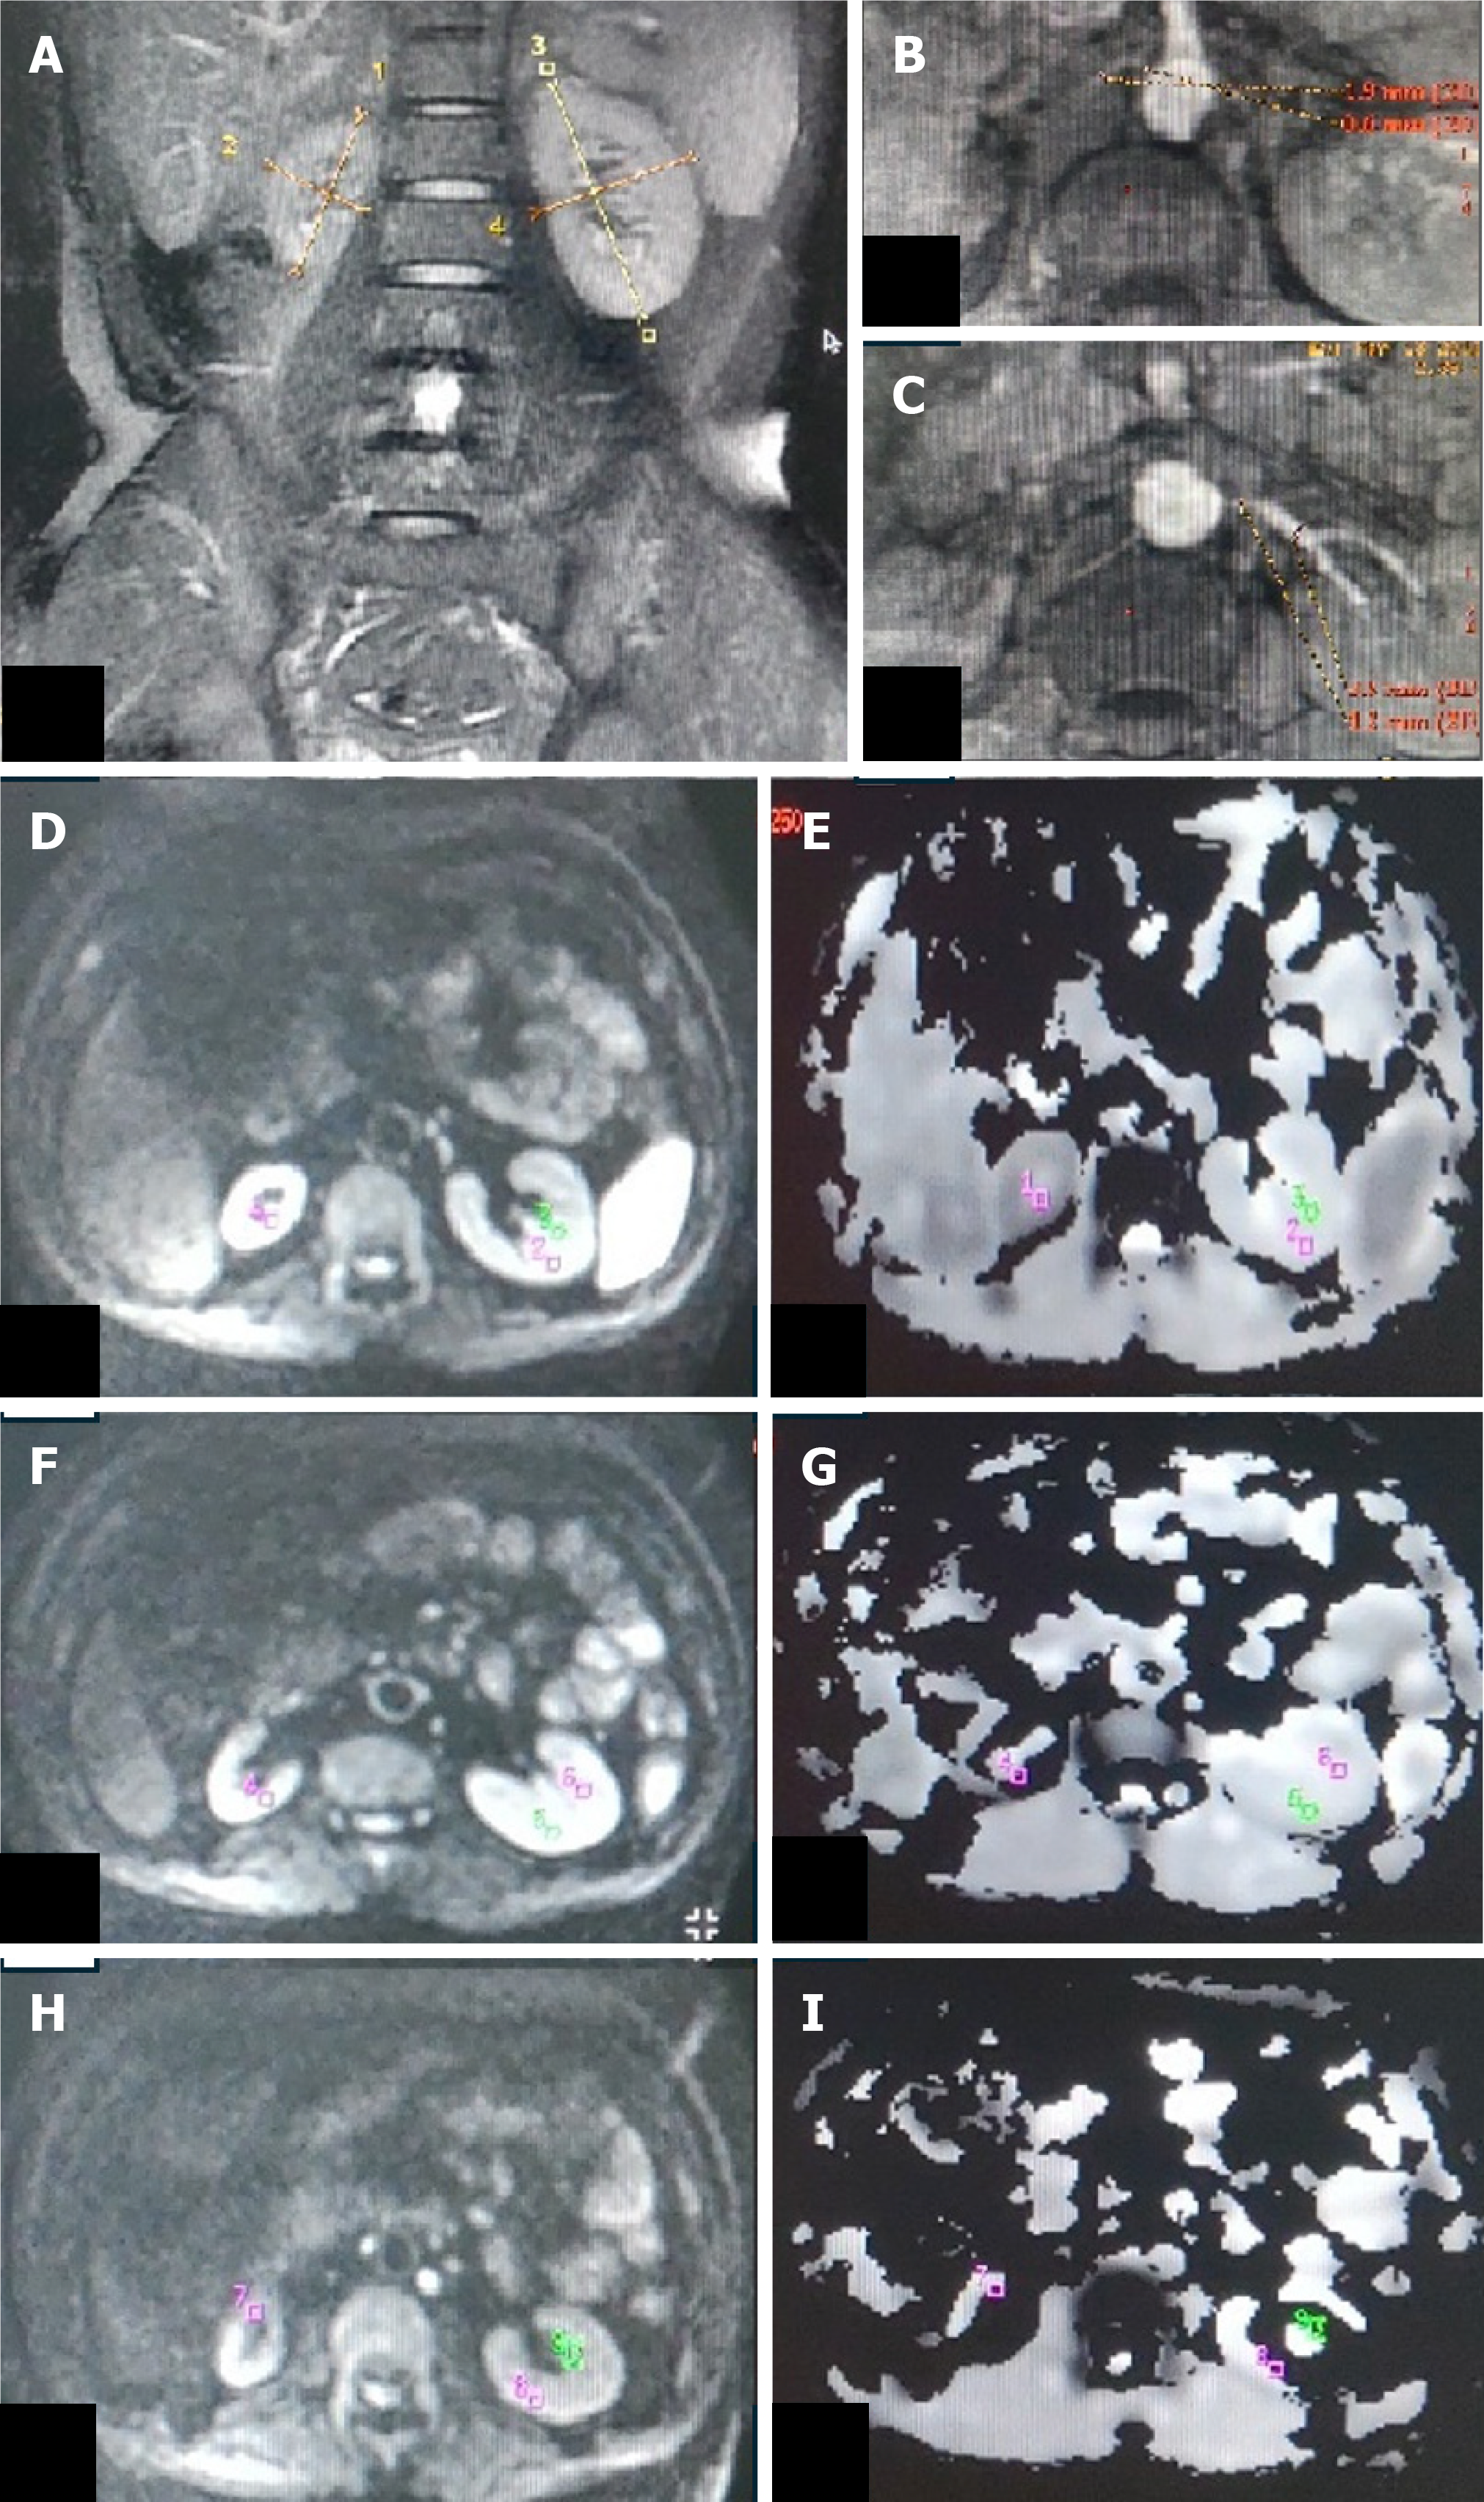
Figure 2 Bilateral renal artery stenosis.
A: T2W magnetic resonance (MR) image (coronal plane) showing atrophic right kidney (6.1 cm) and normal-sized left kidney (9.0 cm); B and C: Non-contrast MR angiography (INHANCE) in axial plane depicting diffuse stenosis of the right renal artery (B) and severe stenosis of the left renal artery at the ostium (C); D-I: Diffusion-weighted MR imaging (DW-MRI) image (D, F, H) in the axial plane with corresponding ADC map (E, G, I) of bilateral kidneys showing manually drawn region-of-interest (ROI) placed in the upper (D, E), middle (F, G) and lower (H, I) pole regions of the bilateral kidney. On the right side, as the kidney is atrophic, the ROI was placed in the corticomedullary region, whereas on the left, the ROI was placed separately in the cortex and medulla. Mean corticomedullary ADC of the right kidney was 1.19 × 10⁻³ mm2/s. Mean cortical ADC and medullary ADC values of the left kidney were 169 × 10-3 mm2/s and 1.76 × 10⁻³ mm2/s, respectively.
- Citation: Lal H, Agarwal S, Ponmalai K, Prasad R, Bhadauria DS, Gambhir S, Mandal S, Kumar S, Yadav P, Jowel P. Apparent diffusion coefficient of kidneys with non-contrast magnetic resonance angiography for functional and anatomical assessment in renal artery stenosis. World J Methodol 2026; 16(1): 107927
- URL: https://www.wjgnet.com/2222-0682/full/v16/i1/107927.htm
- DOI: https://dx.doi.org/10.5662/wjm.v16.i1.107927