Copyright
©The Author(s) 2025.
World J Methodol. Dec 20, 2025; 15(4): 105775
Published online Dec 20, 2025. doi: 10.5662/wjm.v15.i4.105775
Published online Dec 20, 2025. doi: 10.5662/wjm.v15.i4.105775
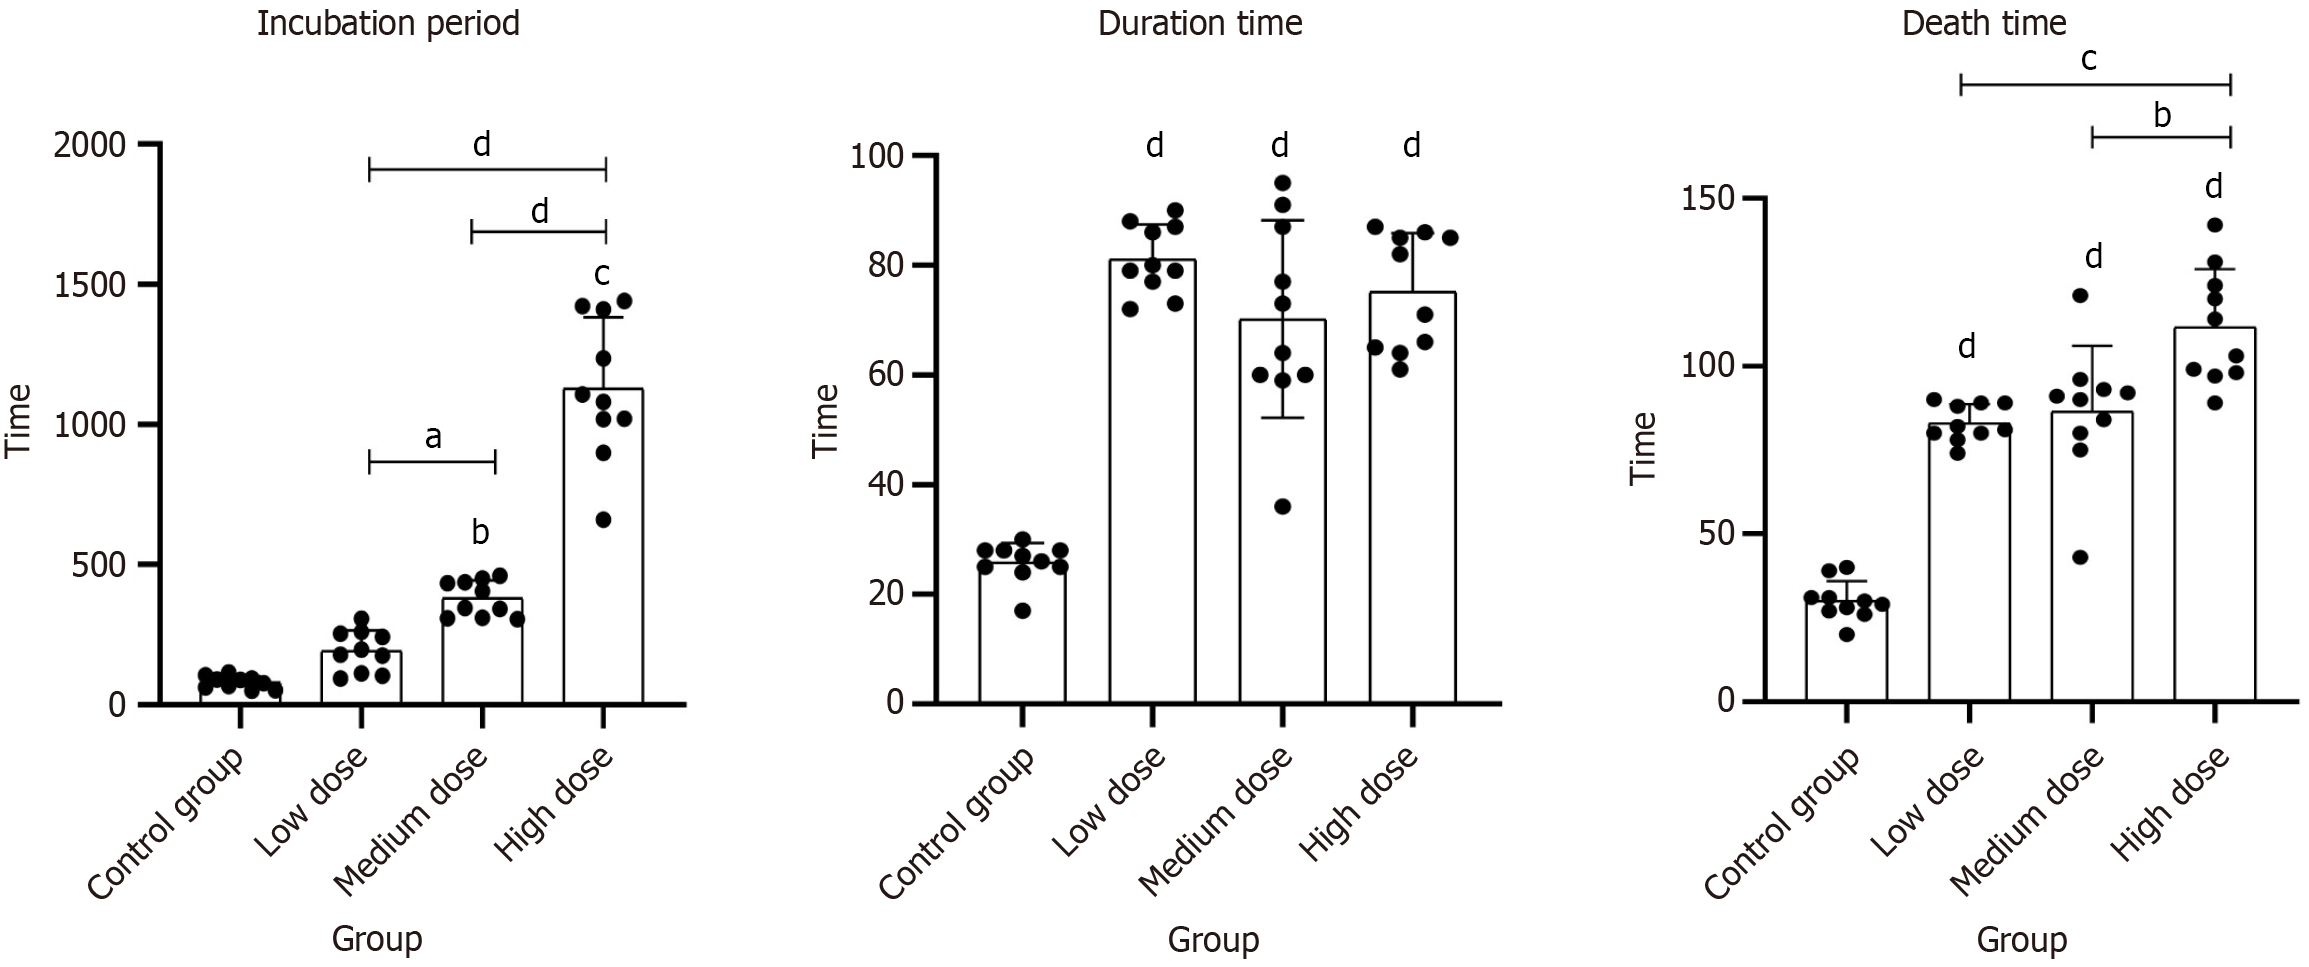
Figure 1 Comparison of incubation period, duration time, and death time among different groups.
The figure presents the comparison of three variables—incubation period, duration time, and death time—among the control, low dose, medium dose, and high dose groups. Each dot represents an individual data point, and the error bars indicate the standard deviation. Statistical significance is marked with asterisks: (1) aP < 0.05; (2) bP < 0.01; (3) cP < 0.001; and (4) dP < 0.0001. Horizontal lines with asterisks above bars denote significant differences between the two connected groups, while asterisks directly above bars indicate significant differences compared to the control group.
- Citation: Xu DJ, Zhong Q, Wang GT, Lu X. Preventive and therapeutic effects of magnesium sulfate on nikethamide-induced seizures: Implications for COVID-19 treatment. World J Methodol 2025; 15(4): 105775
- URL: https://www.wjgnet.com/2222-0682/full/v15/i4/105775.htm
- DOI: https://dx.doi.org/10.5662/wjm.v15.i4.105775


