
















Copyright: ©Author(s) 2026.
World J Transl Med. Jul 28, 2026; 12(2): 118113
Published online Jul 28, 2026. doi: 10.5528/wjtm.118113
Published online Jul 28, 2026. doi: 10.5528/wjtm.118113
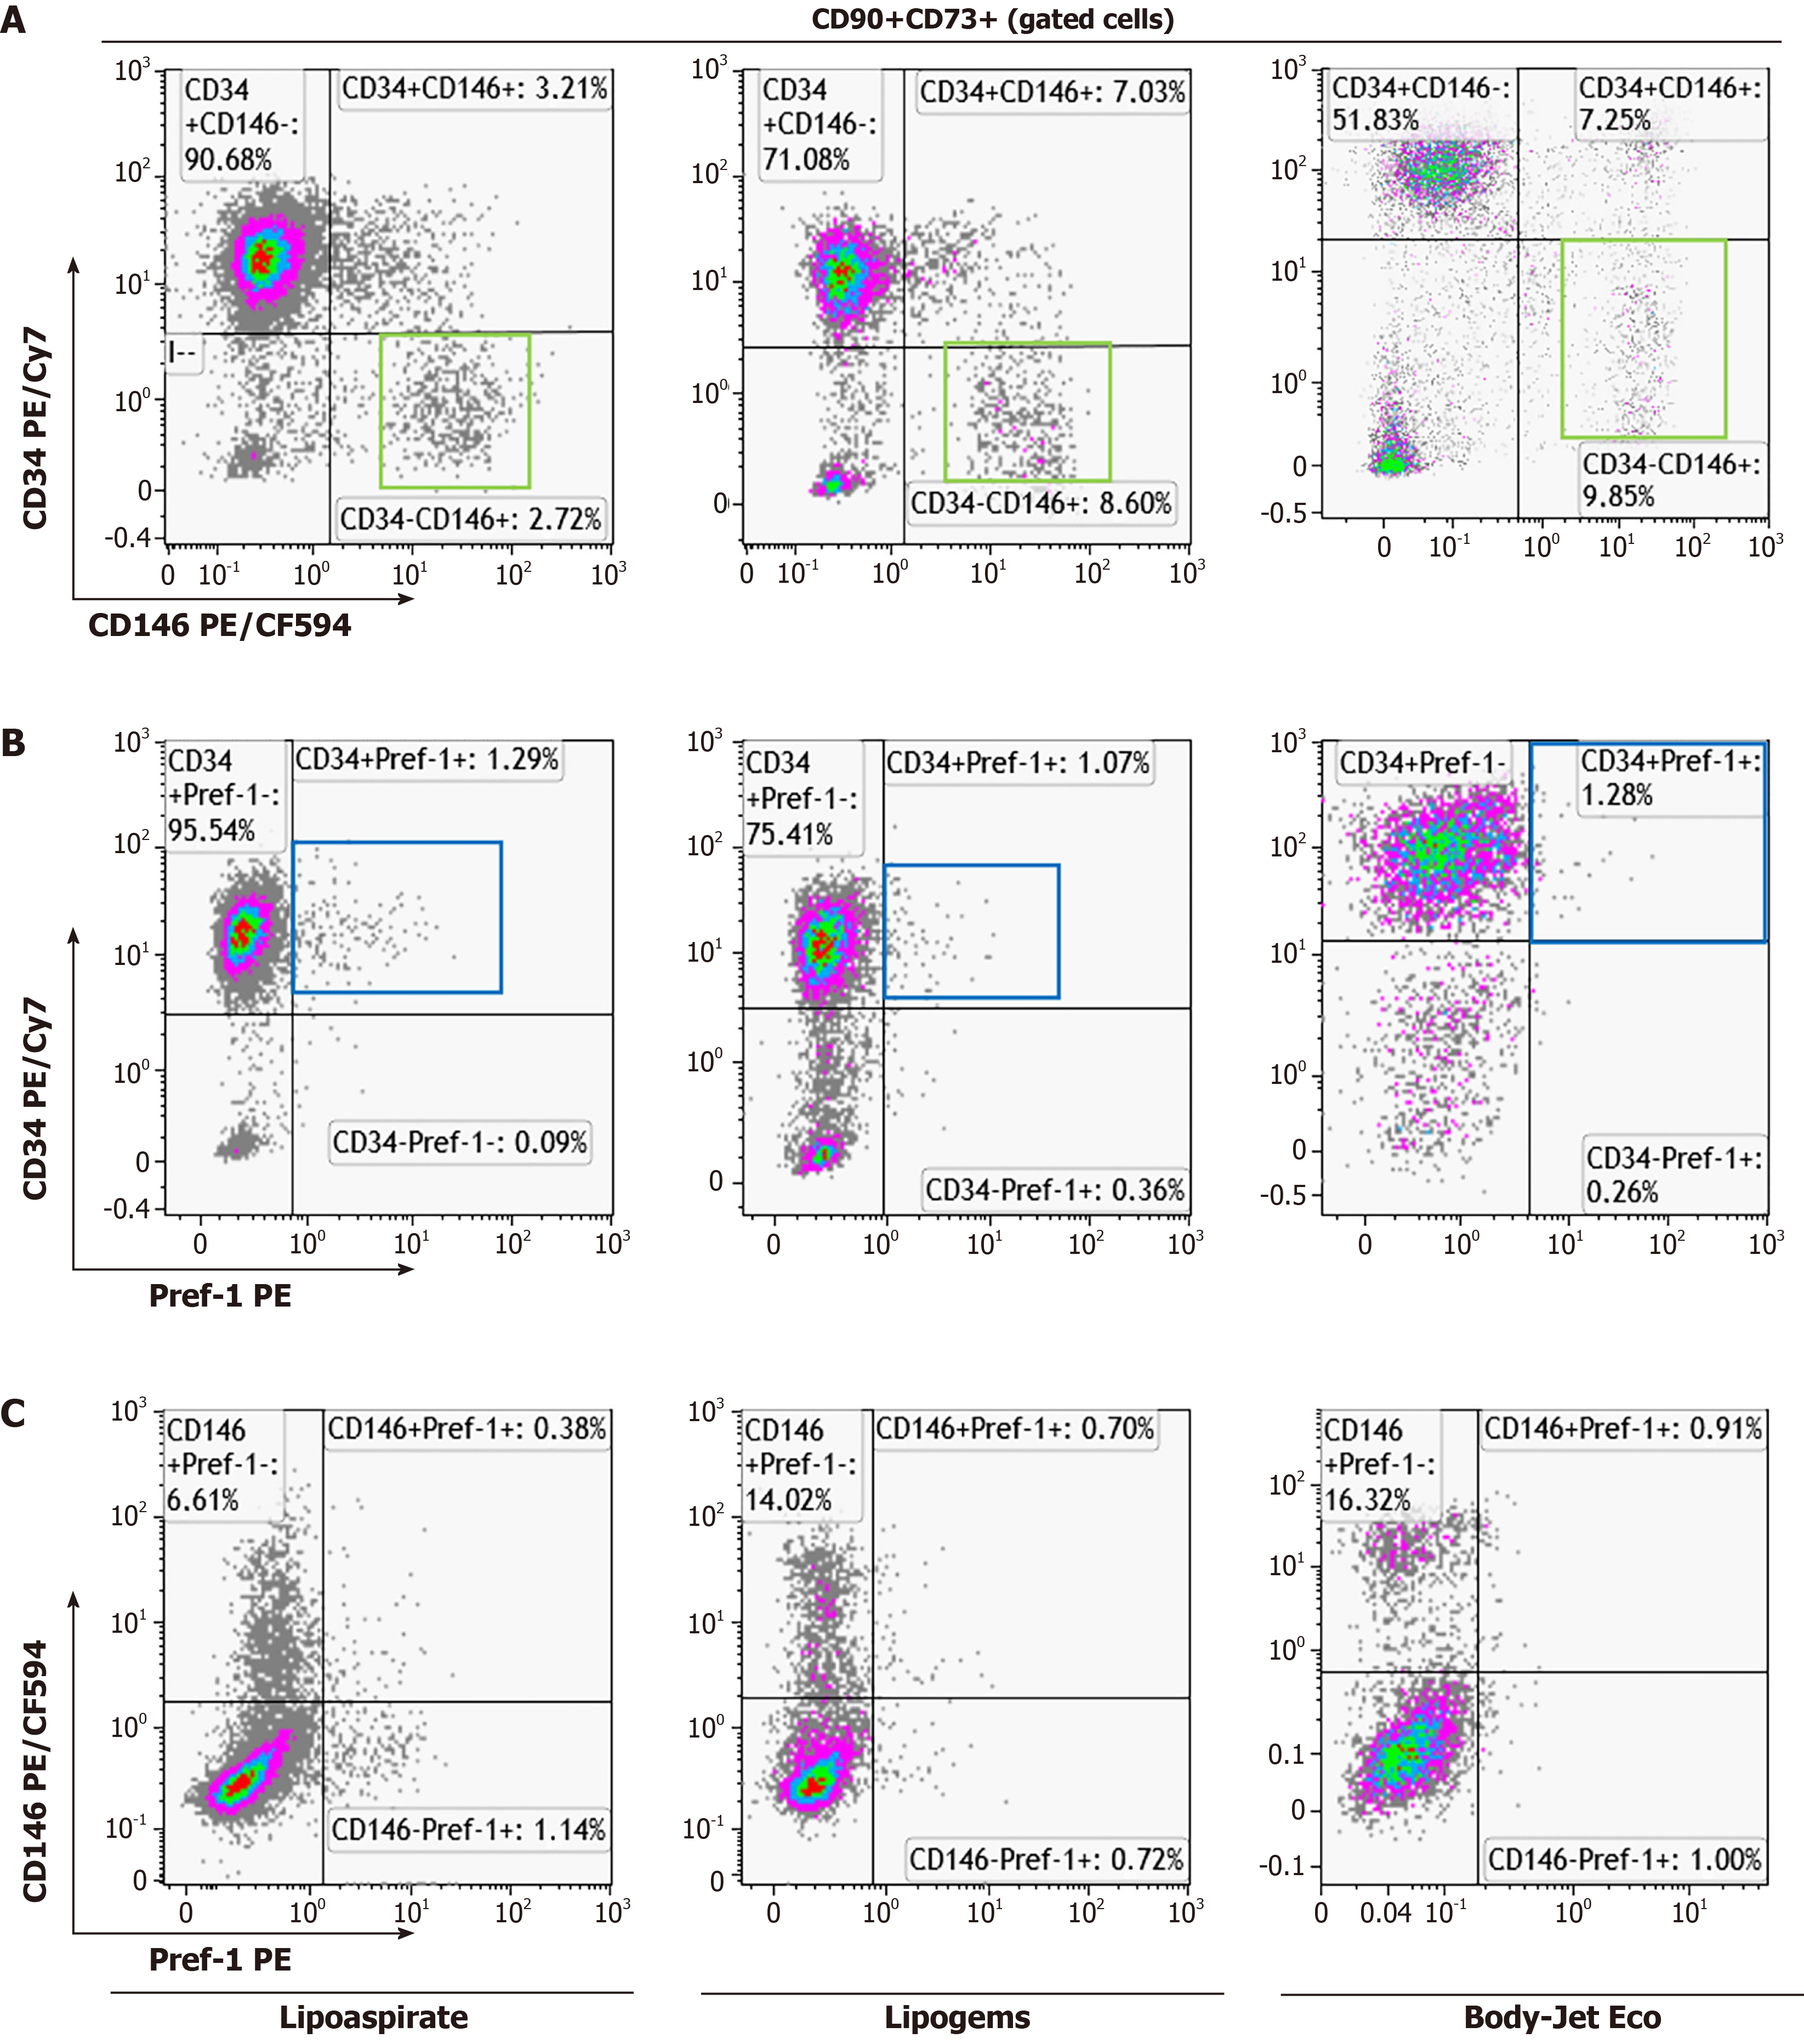
Figure 3 Flow cytometry analysis of pericytes and preadipocytes.
A and B: Analysis of CD34, CD146 and Pref-1 was performed on the CD90+ CD73+CD45- cells, as indicated on top of the density plots. Density plots of CD34 vs CD146 and CD34 vs Pref-1, respectively. Pericytes subpopulation (CD90+CD73+CD45- CD34-CD146+) is highlighted by green boxed regions, while preadipocyte subpopulation (CD90+CD73+CD45- CD34+ Pref-1+), characterized by Pref-1 and CD34 co-expression, is highlighted by blue boxed areas; C: Density plots of CD146 vs Pref-1, indicating their partial co-expression. Results are representative of at least three independent experiments for each isolation procedure.
- Citation: Sciarretta FV, Appierto V, Campisi S, Jeyaraman N, Jeyaraman M. Phenotypic profiling and characterization of stromal vascular fraction using two Novel adipose tissue processing systems. World J Transl Med 2026; 12(2): 118113
- URL: https://www.wjgnet.com/2220-6132/full/v12/i2/118113.htm
- DOI: https://dx.doi.org/10.5528/wjtm.118113