Copyright
©The Author(s) 2017.
World J Nephrol. Jul 6, 2017; 6(4): 188-200
Published online Jul 6, 2017. doi: 10.5527/wjn.v6.i4.188
Published online Jul 6, 2017. doi: 10.5527/wjn.v6.i4.188
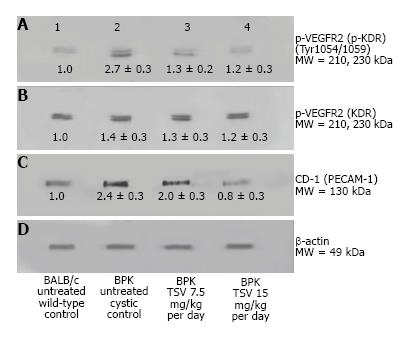
Figure 5 VEGFR2 (KDR) and CD-31 expression in BPK.
Western analysis of the renal expression of VEGF2 (KDR) in BPK (B), and active (p-KDR) in BPK kidneys (A) demonstrate an increased phosphorylation of KDR in untreated cystic kidneys (2) compared to BALB/c untreated wildtype controls (A1). TSV treatment of BPK at 7.5 (A3) and 15 mg/kg per day (A4) respectively, reduced the level of p-KDR in a dose dependent manner to near normal (wildtype) levels. This reduced p-KDR correlated directly with expression levels of CD-31 shown in (C) which was also reduced in a dose dependent manner with TSV treatment. The numbers below the band in each lane represents the average ± SD of the relative density of each band when normalized to the wildtype BALB/c control value arbitrarily set at 1. D is the loading control. Each average represents a minimum of n = 3 individual westerns. These data are confirmed by the morphology of CD-1 stained BPK kidneys shown in Figure 6.
- Citation: Sweeney WE, Frost P, Avner ED. Tesevatinib ameliorates progression of polycystic kidney disease in rodent models of autosomal recessive polycystic kidney disease. World J Nephrol 2017; 6(4): 188-200
- URL: https://www.wjgnet.com/2220-6124/full/v6/i4/188.htm
- DOI: https://dx.doi.org/10.5527/wjn.v6.i4.188


