Copyright
©The Author(s) 2016.
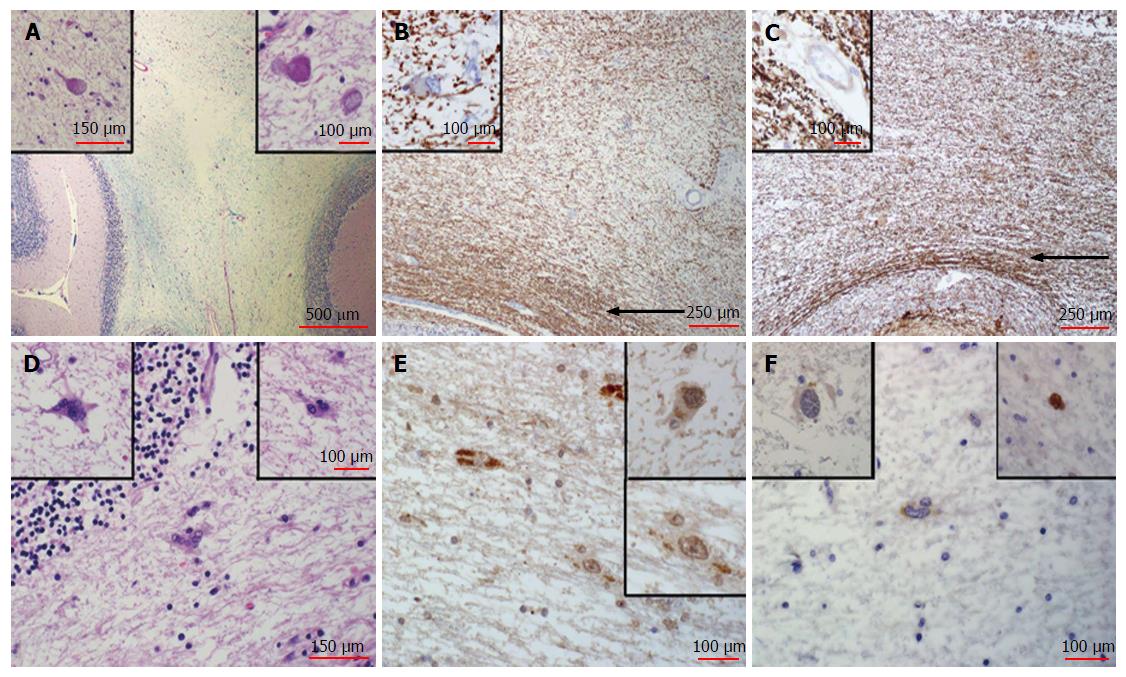
Figure 3 Post-mortem histologic analysis.
A: The cerebellar lesion examined by histology shows a severe loss of myelinated fibers in the white matter, as stained by Luxol blue/Periodic Acid-Schiff. Note central pale area in the image. Also note that the surface folia, stained pink at the lower corners of the image, display no involvement. Inset (left) shows a higher magnification of an axonal spheroid from the region of the lesion, indicative of residual axonal damage, stained by H and E. Inset (right) shows another axonal spheroid from the same region at higher magnification also stained by H and E. Note that the pale lesion lacks evidence of active viral infection, with no macrophage infiltration or other inflammatory processes; B: Myelin basic protein immuno-staining reveals a severe loss of myelinated fibers stained brown in the cerebellar lesion. Note relative sparing of subcortical U-fibers (arrow). Inset (left) Higher magnification of a cell in the lesion stained for myelin basic protein that shows ragged myelin distribution. This demyelination appears to be quiescent; C: Section of the lesion in the cerebellum stained for neurofilament protein shows a loss of axons nearly proportional to the loss of myelin. Note relative sparing of subcortical U-fibers (arrow). Inset (left) shows higher magnification of neurofilament staining in the area of the lesion. Axons apparently lost in the acute phase in 1999 have not regenerated; D: Examples of rare atypical astrocytes found at the periphery of the lesion in H and E stained sections. Insets at higher magnification; E: SV40 immunostaining for T antigen shows some non-specific granular pattern within the cytoplasm of a few glial cells in the region of the lesion, some faint nuclear staining and scattered acellular granular deposits. This staining suggests latent infection with low levels of residual antigen. Insets show examples at higher magnification; F: The p53 immunostain shows that atypical astrocytes are mostly negative. Inset (left) another example of an atypical astrocyte that does not stain at the same magnification, and inset (right) a rare example of a p53 positive atypical glial cell. Macrophages were very rare and p53 staining was not observed. H and E: Hematoxilin and eosin.
- Citation: SantaCruz KS, Roy G, Spigel J, Bearer EL. Neuropathology of JC virus infection in progressive multifocal leukoencephalopathy in remission. World J Virol 2016; 5(1): 31-37
- URL: https://www.wjgnet.com/2220-3249/full/v5/i1/31.htm
- DOI: https://dx.doi.org/10.5501/wjv.v5.i1.31


