
















Copyright: ©Author(s) 2026.
World J Transplant. Jun 18, 2026; 16(2): 118880
Published online Jun 18, 2026. doi: 10.5500/wjt.v16.i2.118880
Published online Jun 18, 2026. doi: 10.5500/wjt.v16.i2.118880
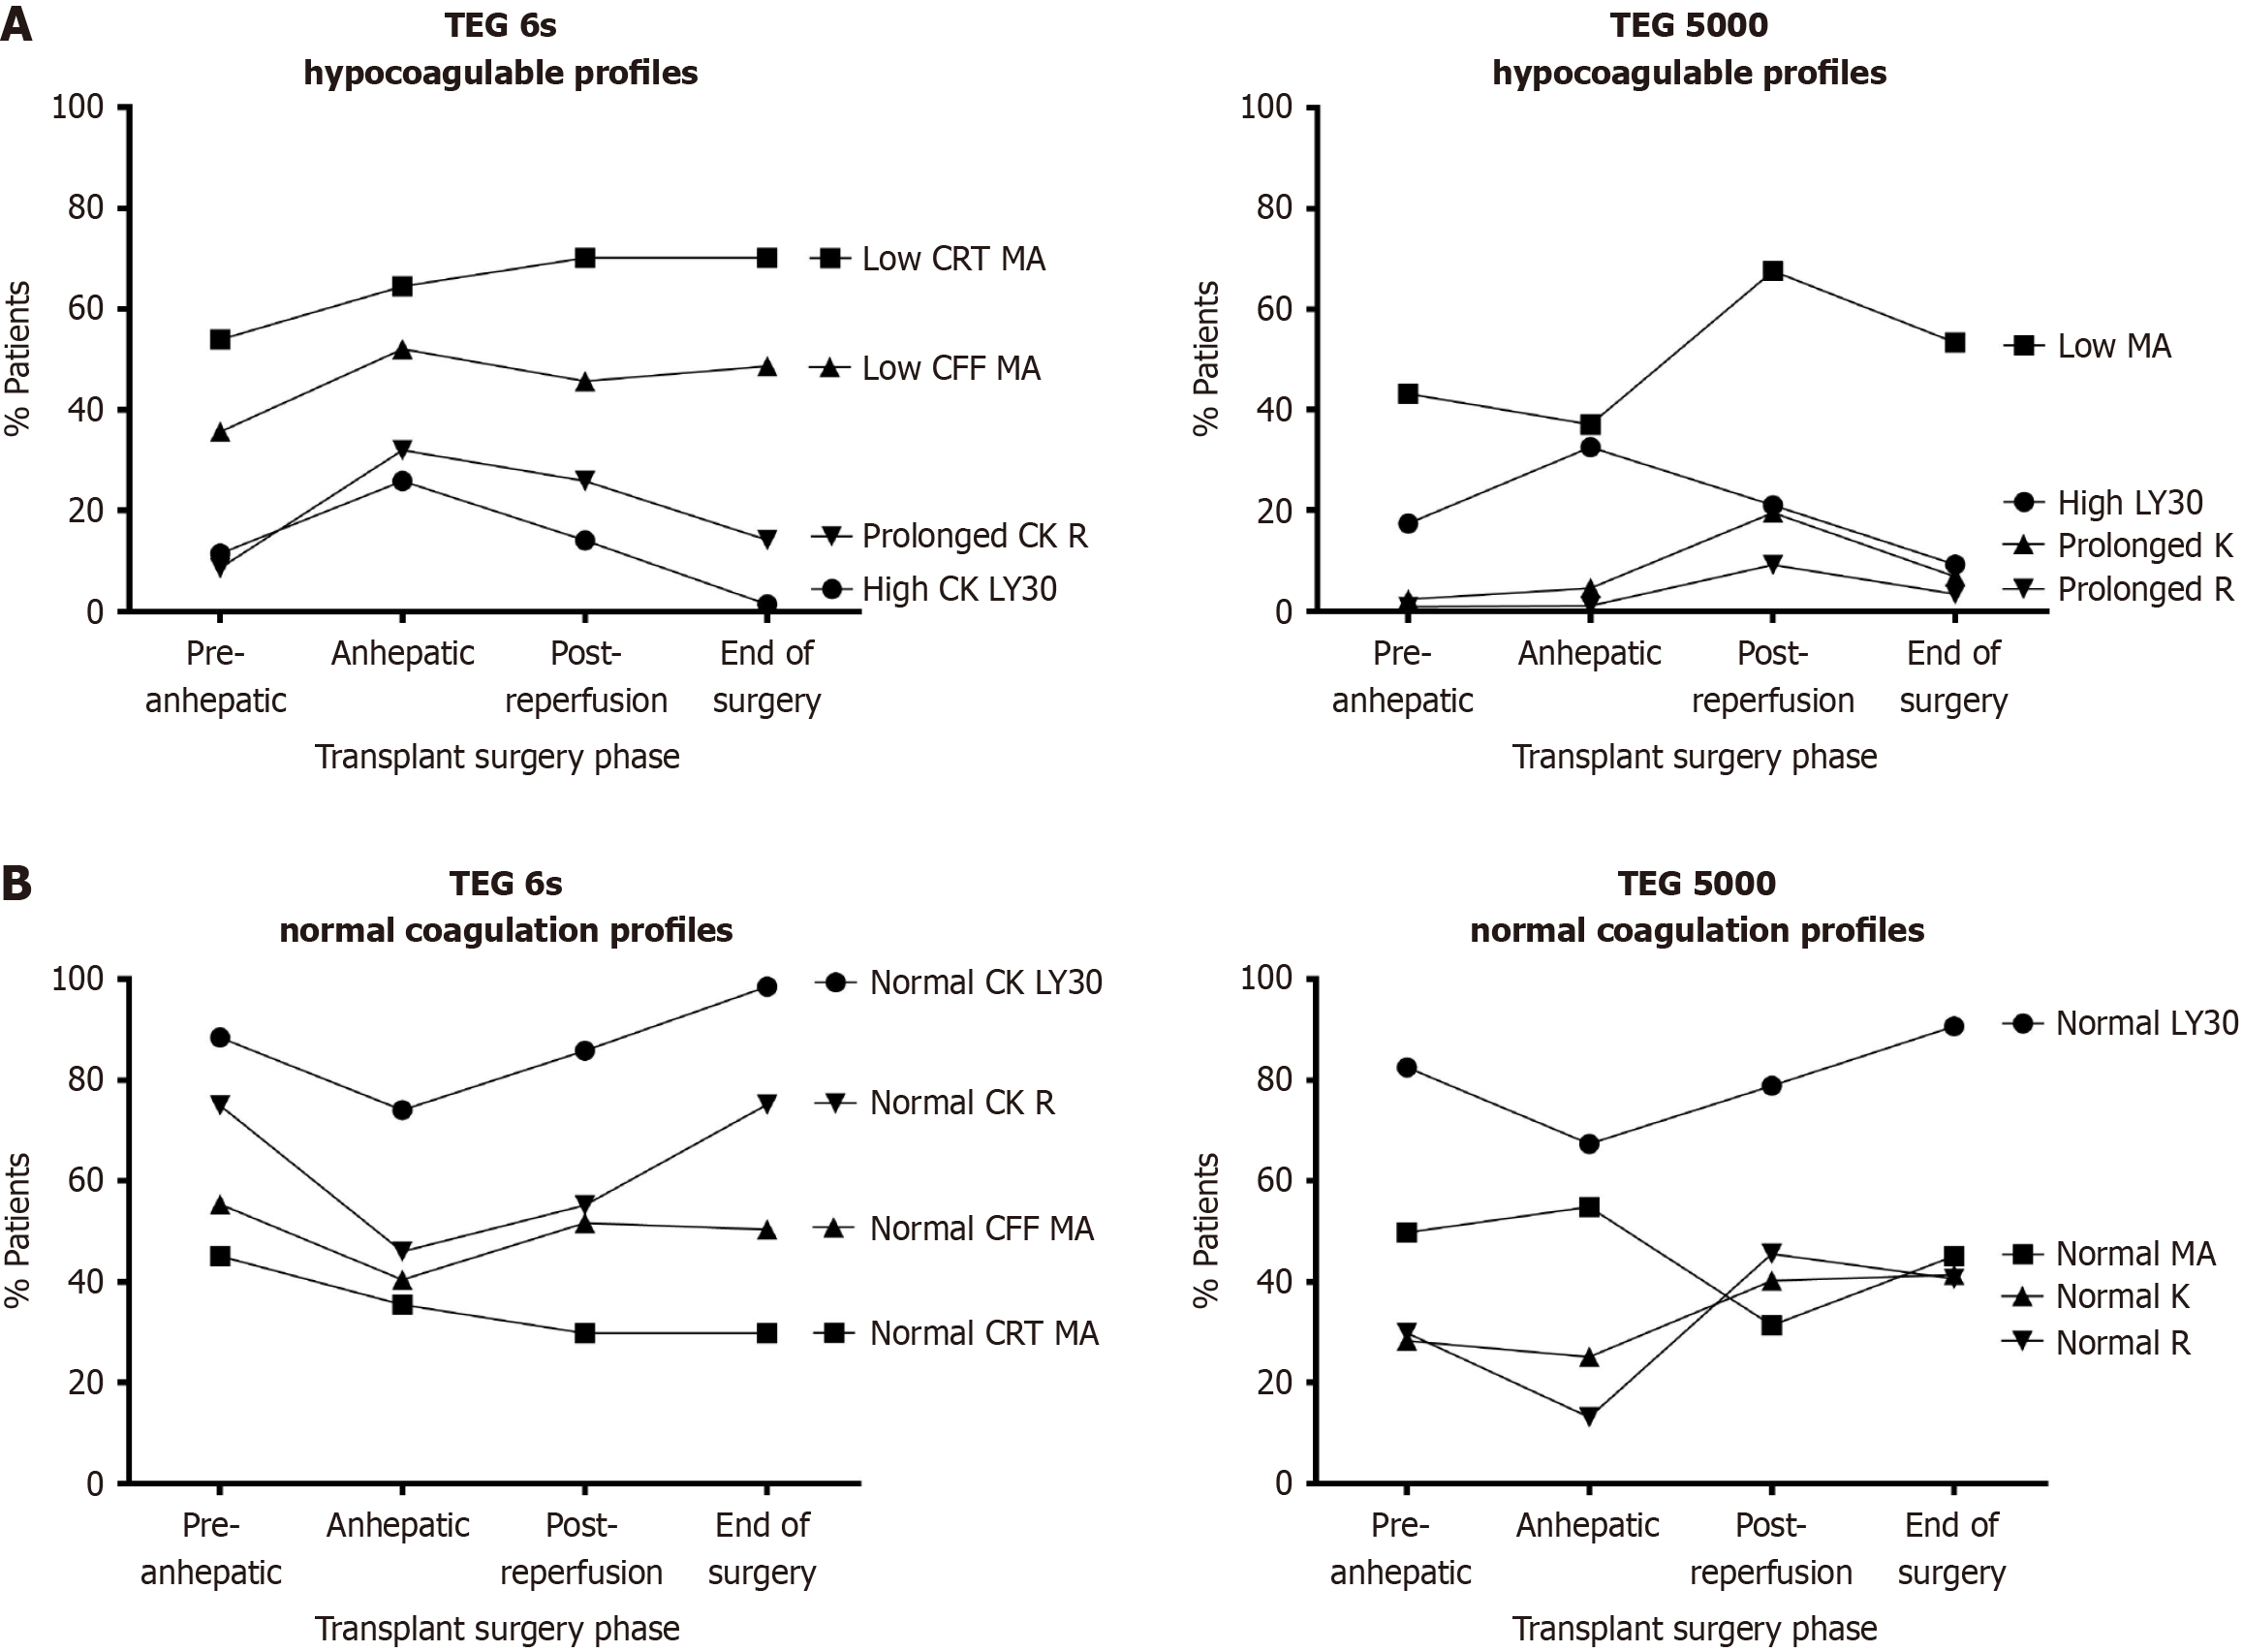
Figure 2 Distribution of patients with hypocoagulability and normal hemostatic parameters across 4 phases of liver transplant surgery.
Hemodynamic parameters were monitored during transplant surgery with either the thromboelastography (TEG) 6s or TEG 5000 platforms. Hemodynamic trends suggest higher rates of hypocoagulability may occur during the anhepatic and post-reperfusion phases. A: The show proportions of patients with TEG results indicating hypocoagulability; B: The show proportions of patients with normal hemostatic TEG results over time. Denominators for percentages vary per parameter and result range (Table 2). Reference ranges for all parameters are in Supplementary Table 1. TEG: Thromboelastography; CRT: Citrated rapid thromboelastography; MA: Maximum amplitude; CFF: Citrated functional fibrinogen; CK: Citrated kaolin; R: Reaction time; LY30: Percent clot lysis at 30 minutes post-maximum amplitude; K: Kinetics time.
- Citation: Maroun W, Osborn ZF, Garg P, Angappan S, El-Bashir J, Heppell O, Soetedjo J, Pillai S, Miyake K, Mohamed A, Nagai S, Guerra-Londono CE. Thromboelastographic description of intraoperative coagulopathy in patients undergoing liver transplant surgery: A single-center observational study. World J Transplant 2026; 16(2): 118880
- URL: https://www.wjgnet.com/2220-3230/full/v16/i2/118880.htm
- DOI: https://dx.doi.org/10.5500/wjt.v16.i2.118880