
















Copyright: ©Author(s) 2026.
World J Psychiatry. Nov 19, 2026; 16(11): 122026
Published online Nov 19, 2026. doi: 10.5498/wjp.122026
Published online Nov 19, 2026. doi: 10.5498/wjp.122026
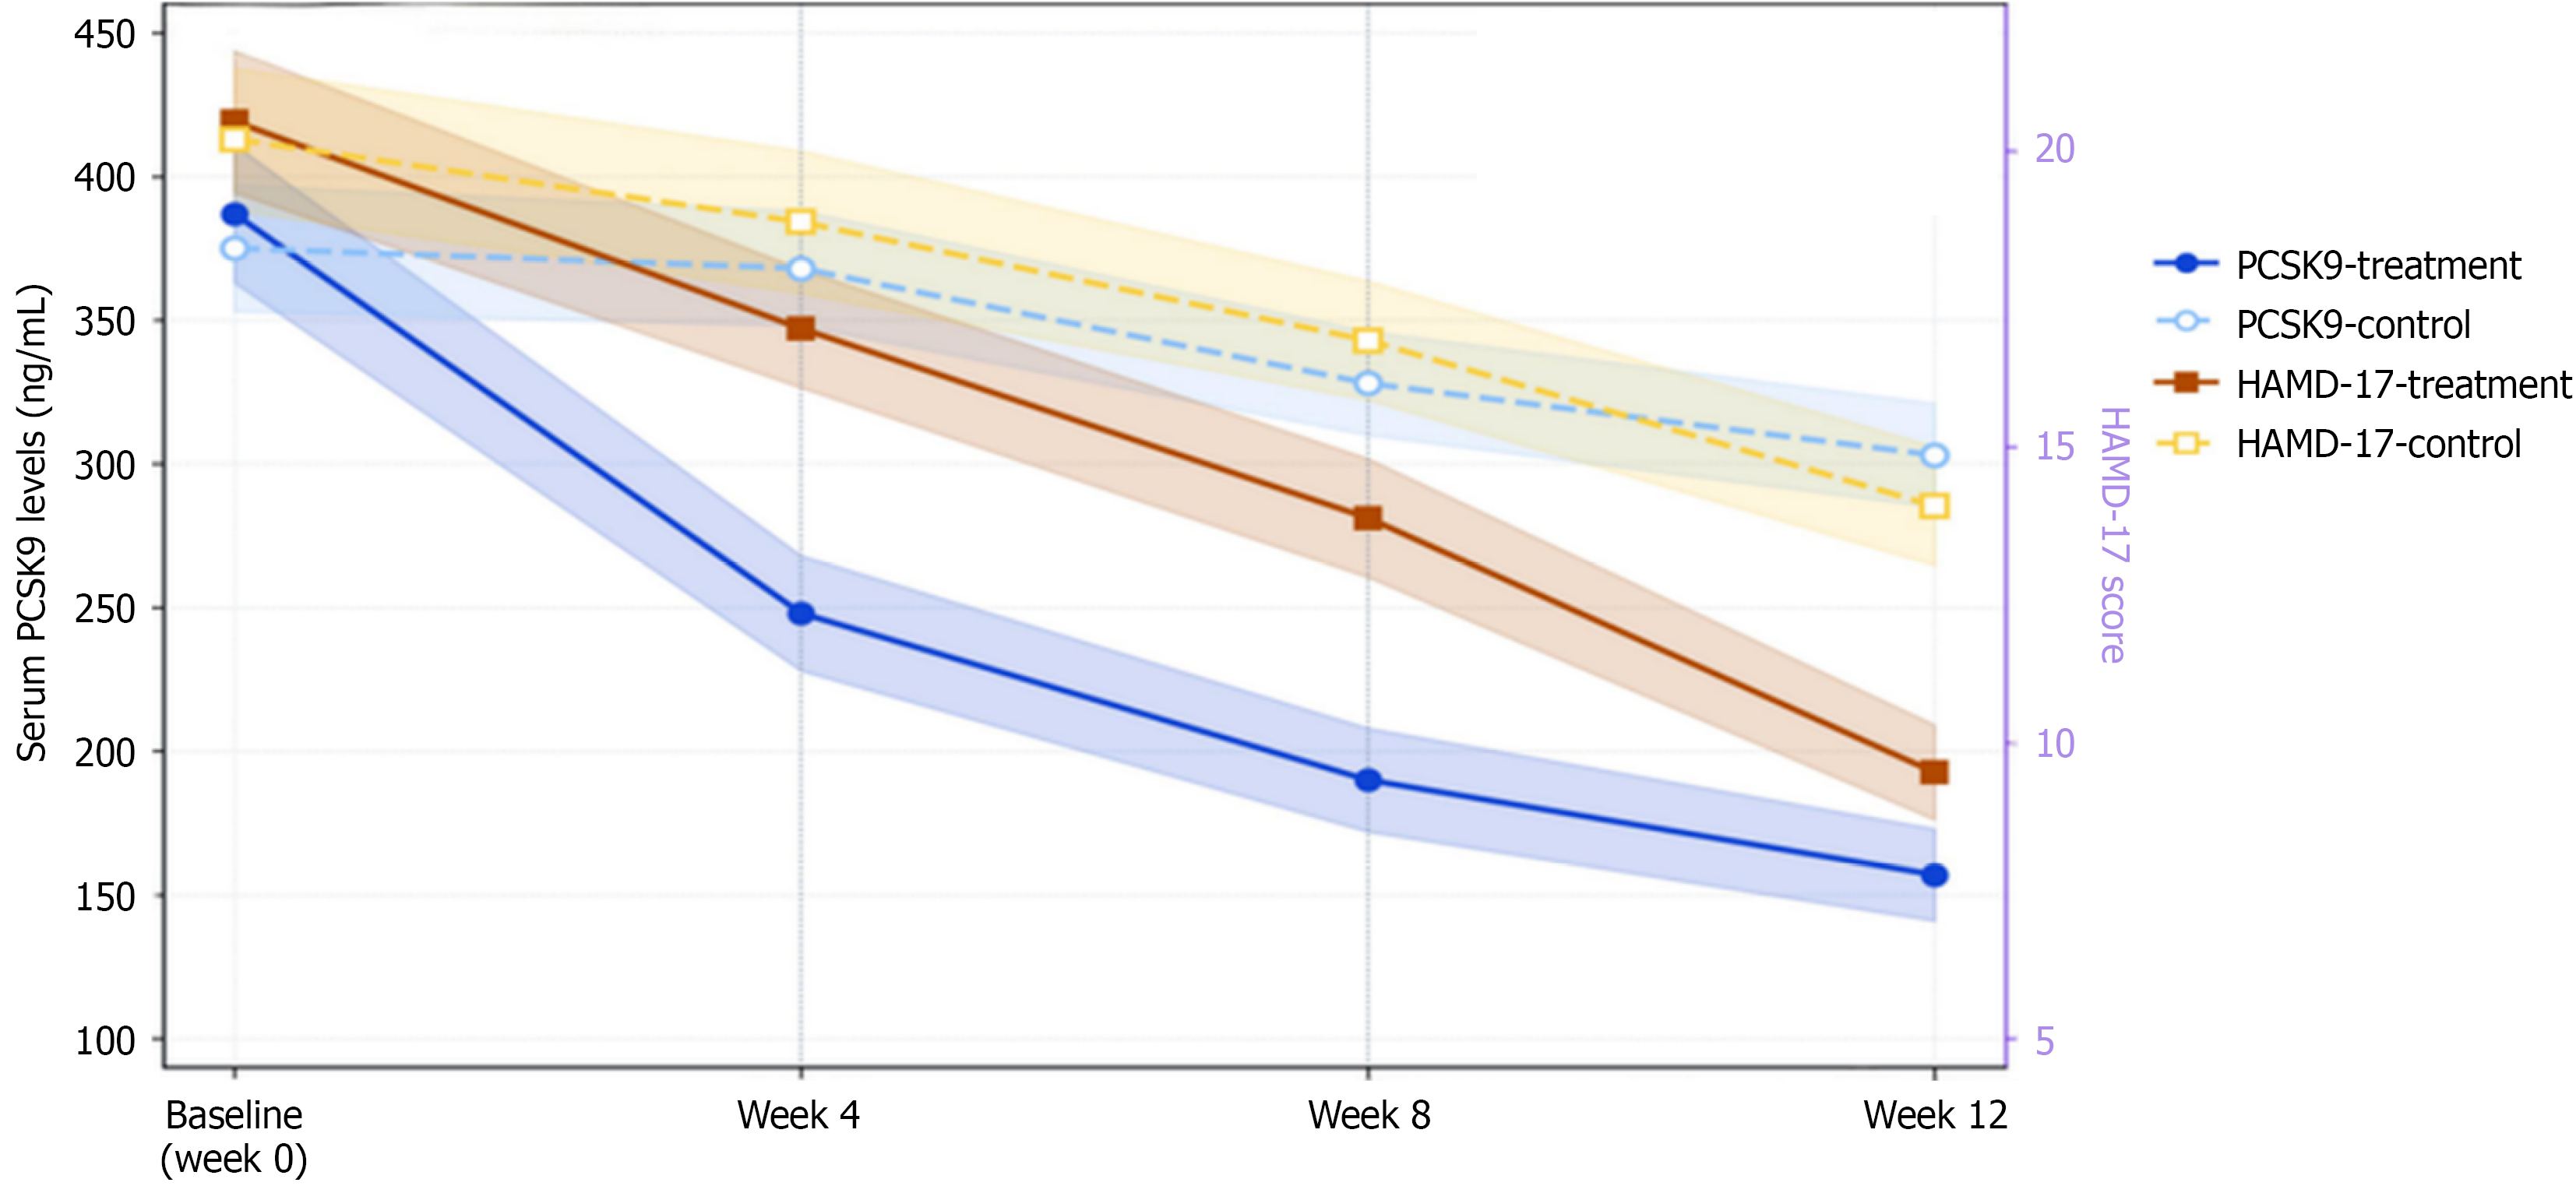
Figure 2 Time course of serum proprotein convertase subtilisin/kexin type 9 concentrations and depression scores.
The dual-axis line graph shows serum proprotein convertase subtilisin/kexin type 9 (PCSK9) concentrations (left axis, ng/mL) and 17-item Hamilton Depression Rating Scale (HAMD-17) scores (right axis) during the 12-week observation period. Solid lines indicate the combination-therapy group (evolocumab plus atorvastatin); dashed lines indicate the control group (atorvastatin alone). PCSK9 concentrations were lower in the combination-therapy group at weeks 4, 8, and 12. HAMD-17 scores differed significantly between groups at weeks 8 and 12, but not at week 4 (P = 0.076; Table 3). Parallel changes in PCSK9 concentrations and depression scores are descriptive and do not establish a causal mechanism. Error bars represent the standard error of the mean. PCSK9: Proprotein convertase subtilisin/kexin type 9; HAMD-17: 17-item Hamilton Depression Rating Scale.
- Citation: Song HY, Yang Y, Sun XY, Zhang MJ, Wang SG. Serum proprotein convertase subtilisin/kexin type 9 levels correlate with depression severity in post-stroke patients. World J Psychiatry 2026; 16(11): 122026
- URL: https://www.wjgnet.com/2220-3206/full/v16/i11/122026.htm
- DOI: https://dx.doi.org/10.5498/wjp.122026