Copyright
©The Author(s) 2025.
World J Psychiatry. May 19, 2025; 15(5): 103628
Published online May 19, 2025. doi: 10.5498/wjp.v15.i5.103628
Published online May 19, 2025. doi: 10.5498/wjp.v15.i5.103628
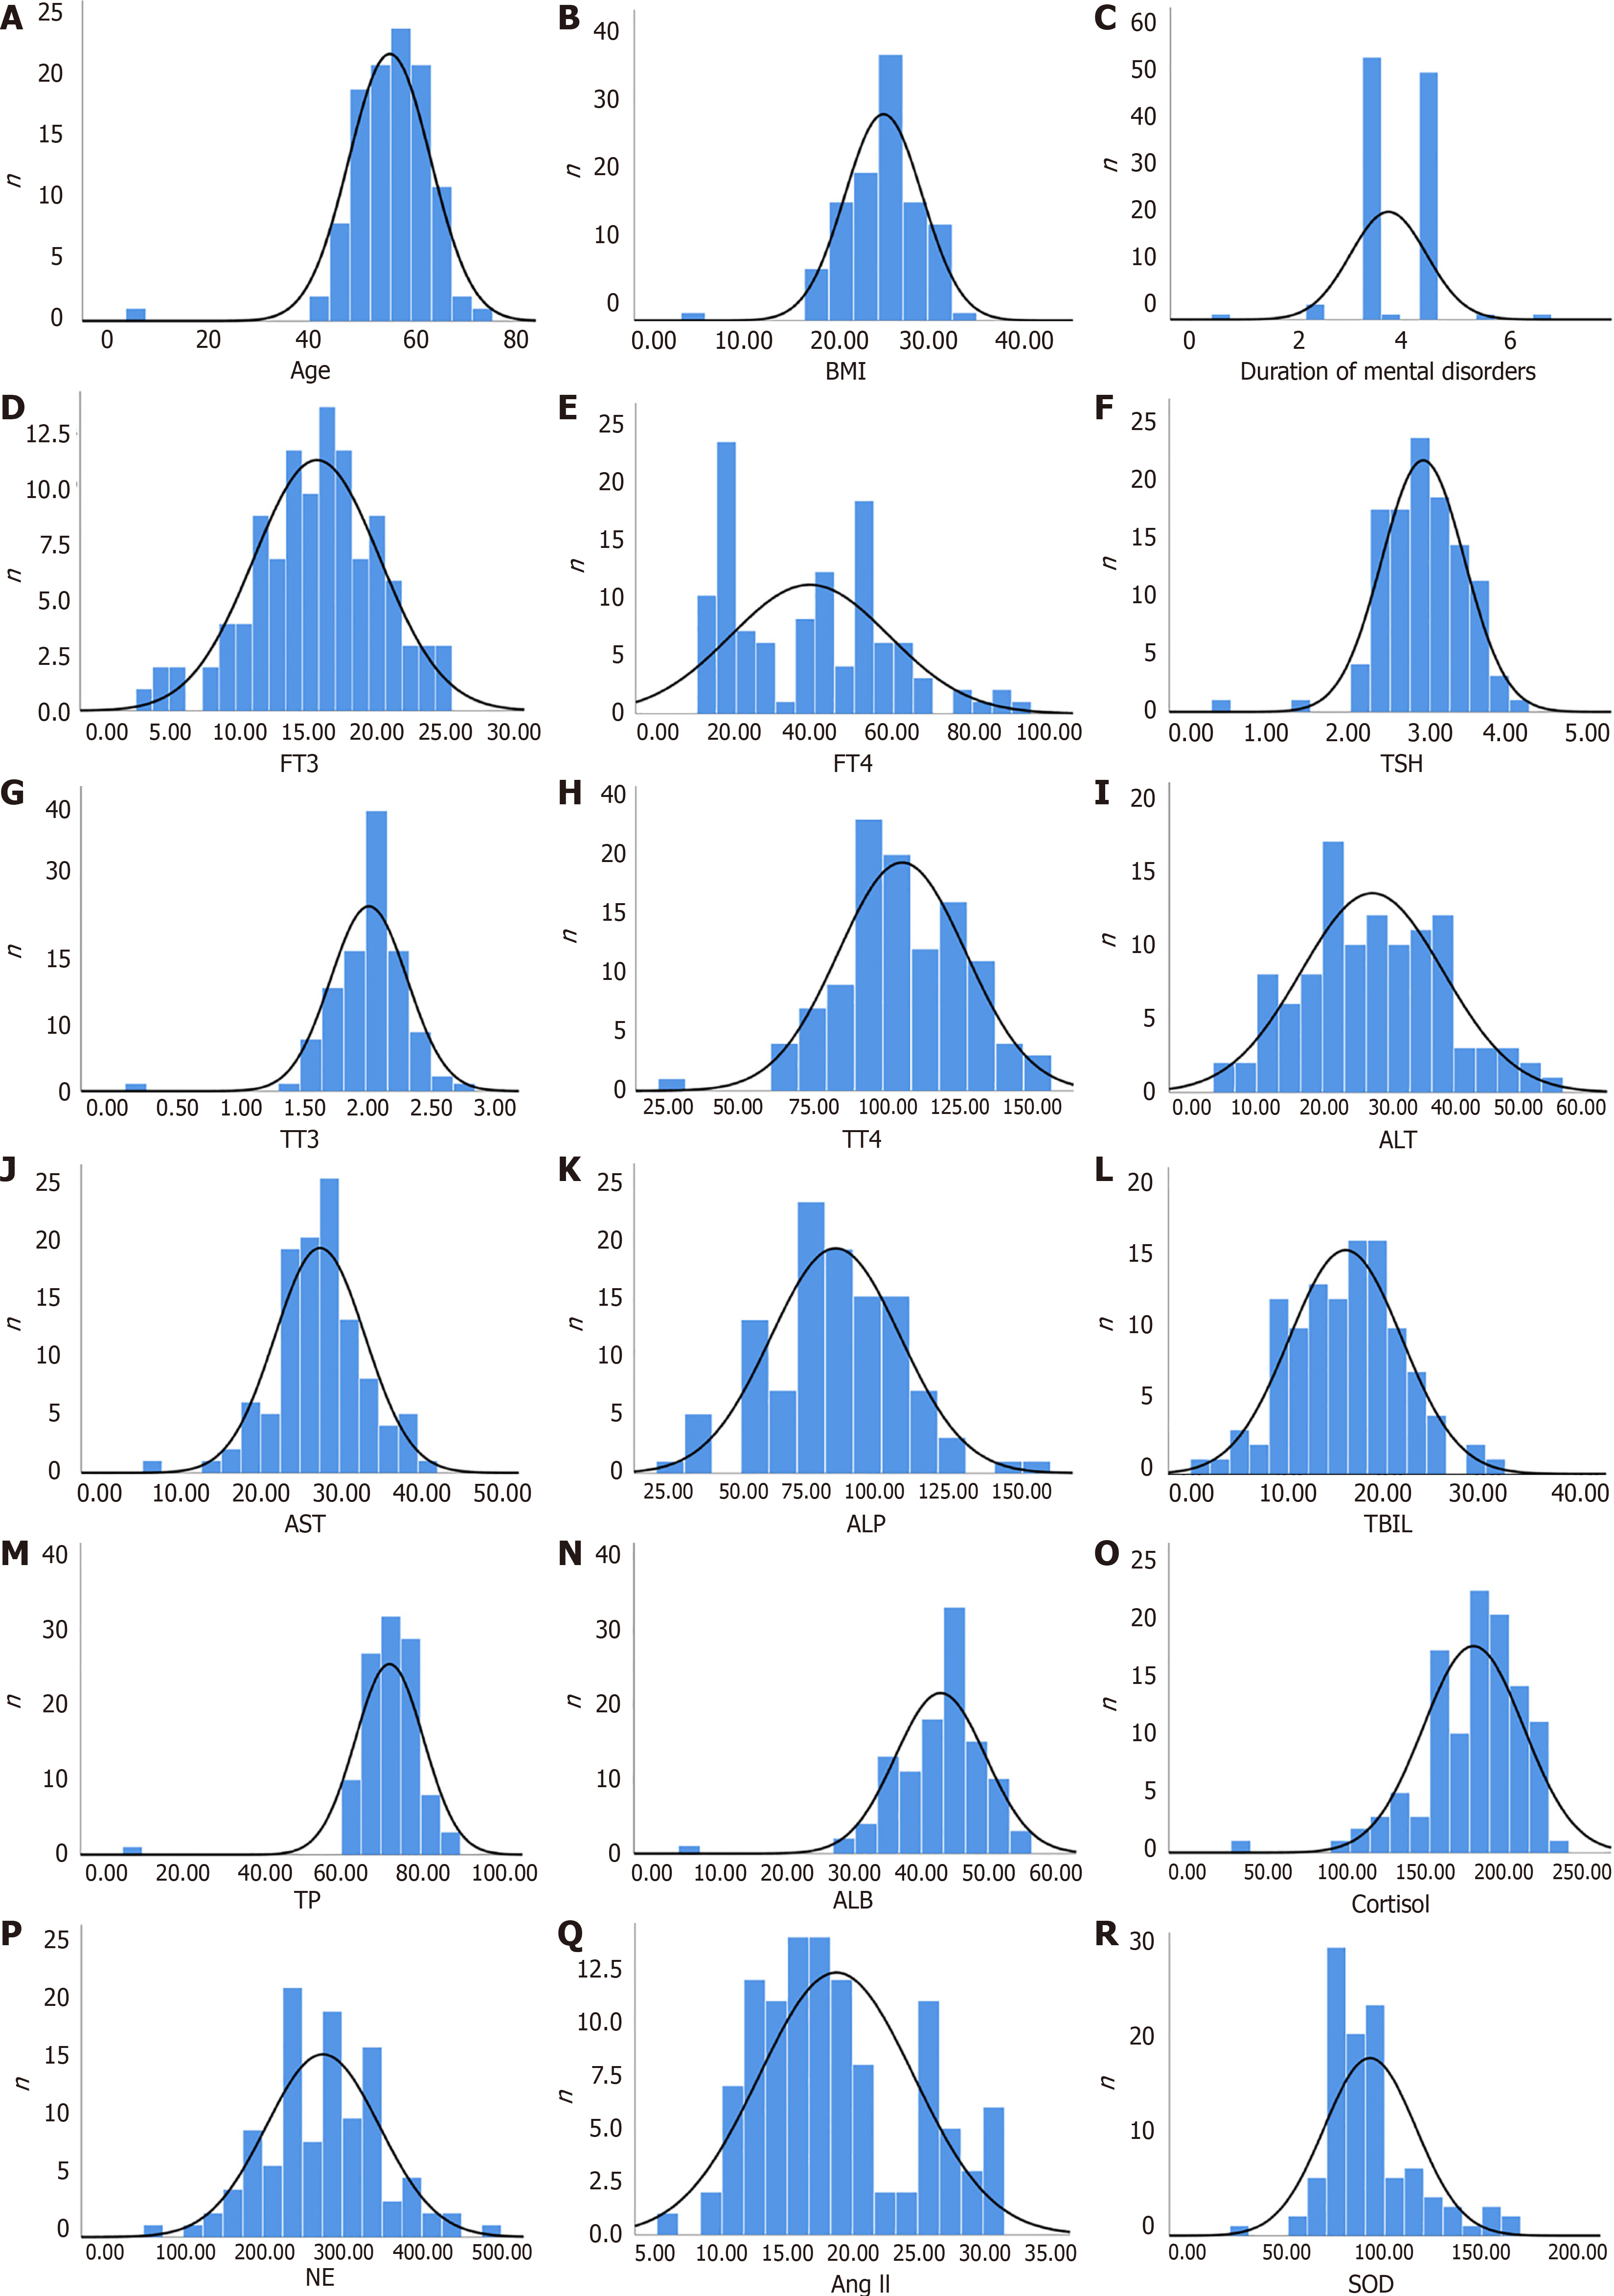
Figure 2 Measurements for all participants.
A: Age distribution plot illustrating the mean age of participants in each group; B: Body mass index distribution showing the average body mass index for each group; C: Duration of psychiatric disorders among participants; D: Comparison of serum free T3 levels among groups; E: Summary of serum free T4 levels indicating significant differences between groups; F: Distribution of thyroid stimulating hormone levels; G: Summary of total triiodothyronine levels; H: Comparison of total thyroxine levels; I: Distribution of alanine aminotransferase levels among groups; J: Summary of aspartine aminotransferase levels; K: Comparison of alkaline phosphatase levels; L: Distribution of total bilirubin levels indicating notable variations between groups; M: Summary of total protein levels; N: Comparison of albumin levels showing significant differences; O: Distribution of cortisol levels; P: Summary of norepinephrine levels; Q: Comparison of angiotensin II levels; R: Distribution of superoxide dismutase levels showing significant variation among the three groups. BMI: Body mass index; FT3: Serum free T3; FT4: Serum free T4; TSH: Thyroid stimulating hormone; TT3: Total triiodothyronine; TT4: Total thyroxine; ALT: Alanine aminotransferase; AST: Aspartate aminotransferase; ALP: Alkaline phosphatase; TBIL: Total bilirubin; TP: Total protein; ALB: Albumin; NE: Norepinephrine; Ang II: Angiotensin II; SOD: Superoxide dismutase.
- Citation: Jia JL, Han JH, Pang R, Bi W, Liu B, Yang K. Predictors of poor prognosis in long-term survivors of differentiated thyroid cancer with psychiatric disorders. World J Psychiatry 2025; 15(5): 103628
- URL: https://www.wjgnet.com/2220-3206/full/v15/i5/103628.htm
- DOI: https://dx.doi.org/10.5498/wjp.v15.i5.103628


