Copyright
©The Author(s) 2020.
World J Psychiatr. Jan 19, 2020; 10(1): 1-11
Published online Jan 19, 2020. doi: 10.5498/wjp.v10.i1.1
Published online Jan 19, 2020. doi: 10.5498/wjp.v10.i1.1
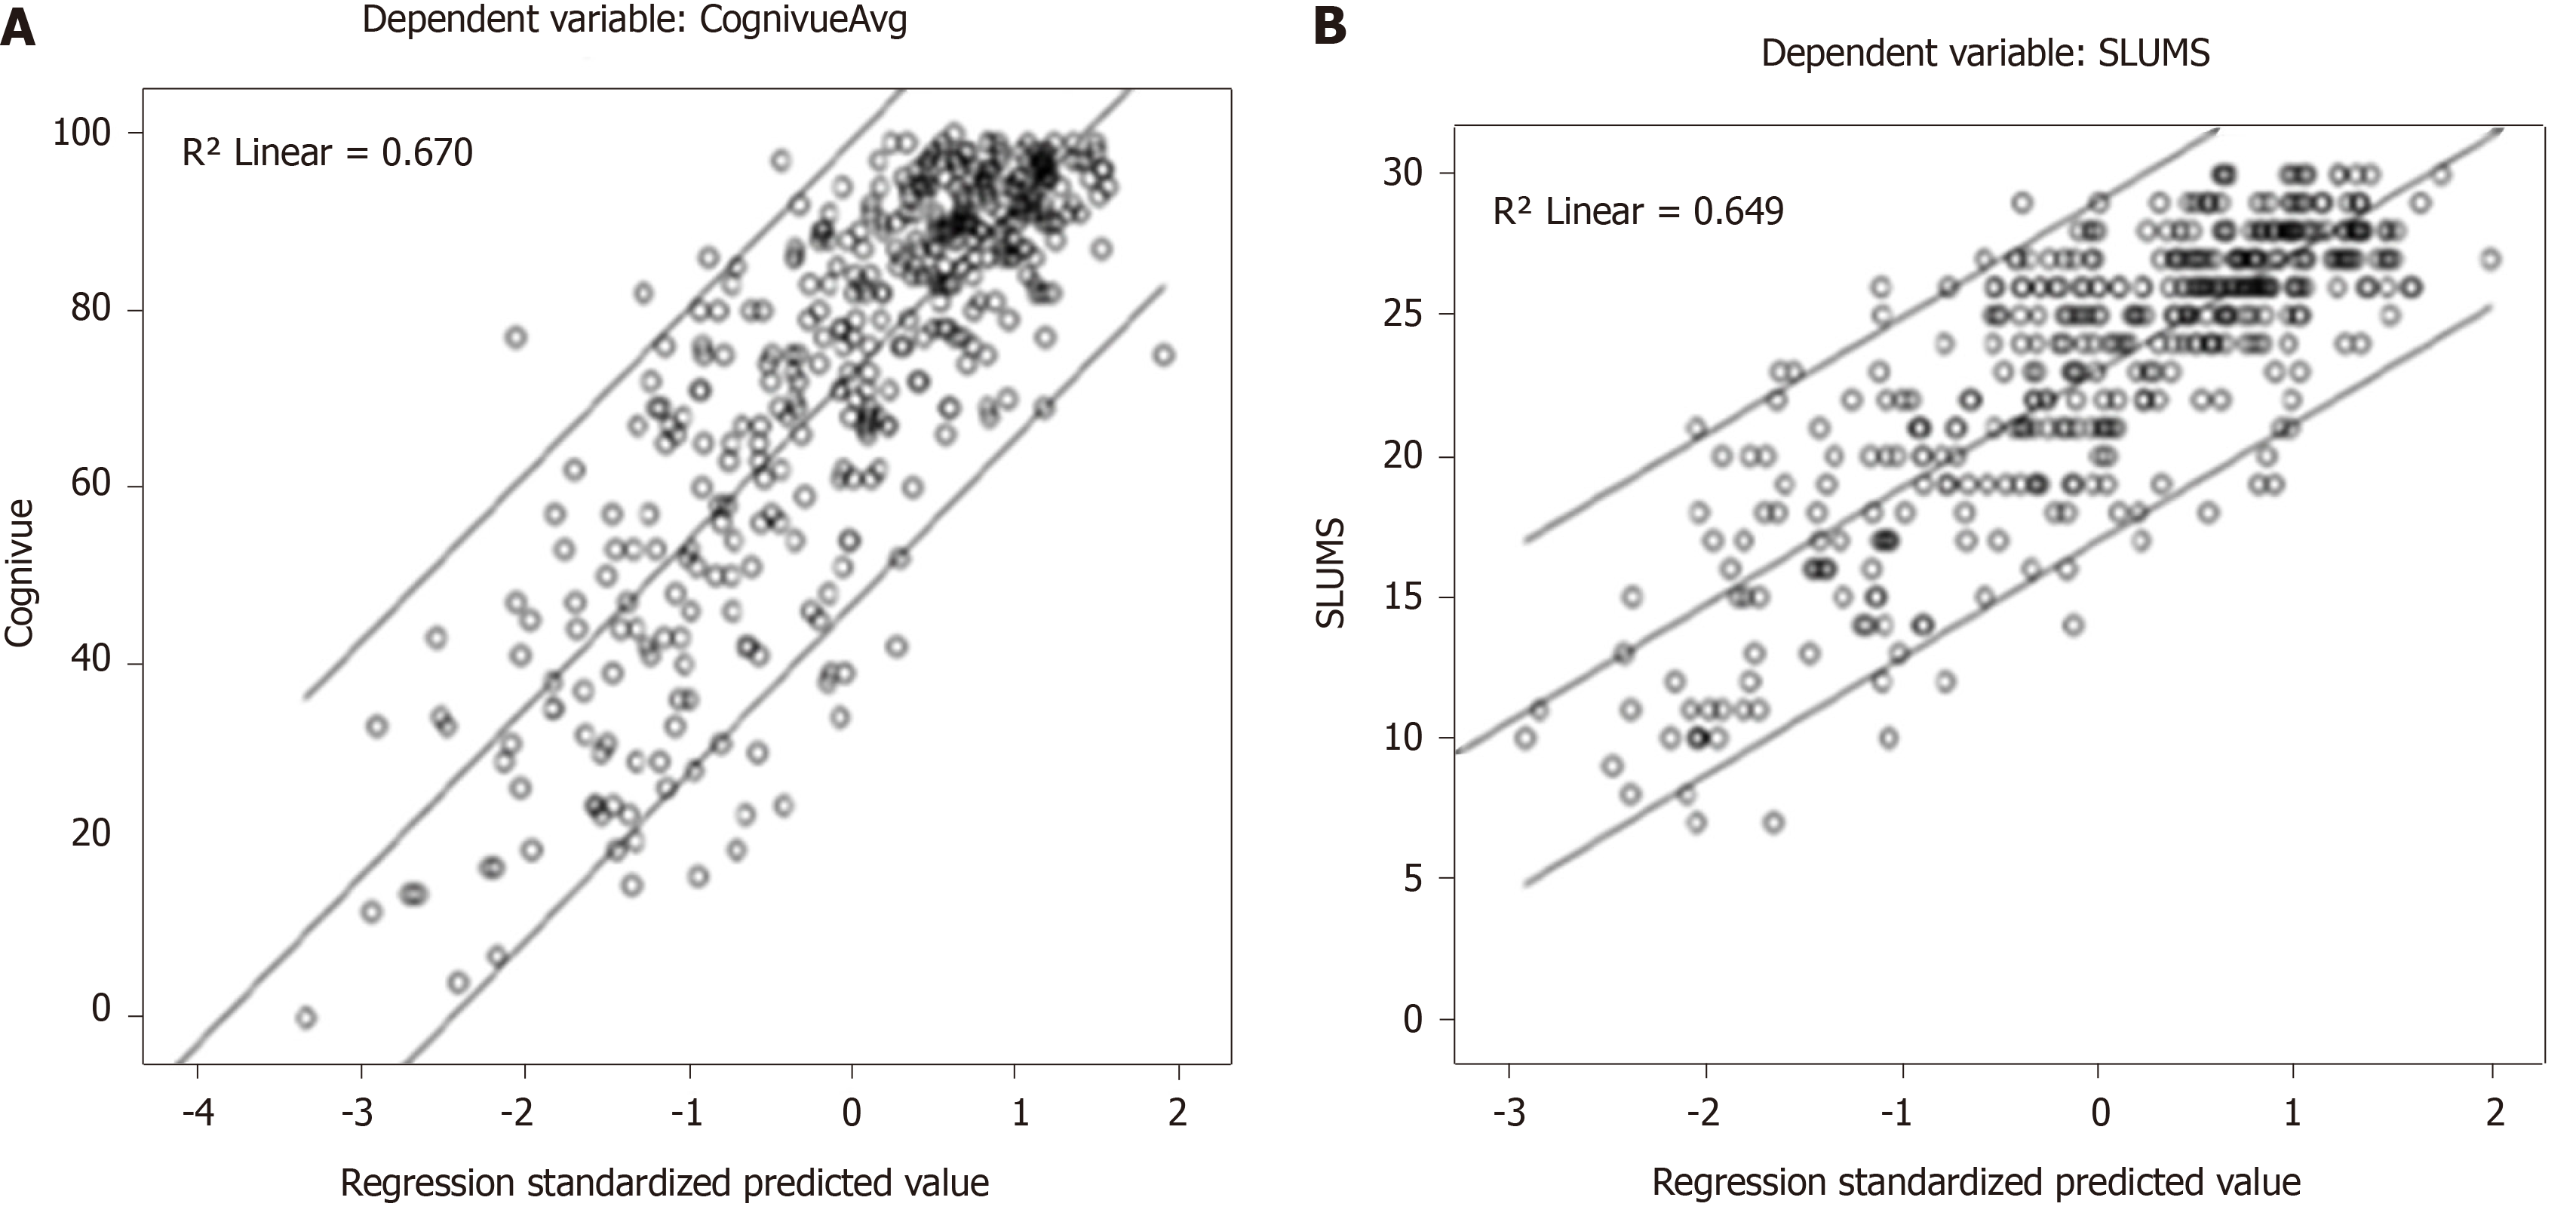
Figure 4 Scatterplot showing regression standardized predicted values including all five factors and Cognivue® scores or the St Louis University Mental Status scores co-plotted with linear regression lines.
A: Cognivue®; B: St. Louis University Mental Status. Avg: Average; R2: Coefficient of determination; SLUMS: St. Louis University Mental Status.
- Citation: Cahn-Hidalgo D, Estes PW, Benabou R. Validity, reliability, and psychometric properties of a computerized, cognitive assessment test (Cognivue®). World J Psychiatr 2020; 10(1): 1-11
- URL: https://www.wjgnet.com/2220-3206/full/v10/i1/1.htm
- DOI: https://dx.doi.org/10.5498/wjp.v10.i1.1


