Copyright
©The Author(s) 2022.
World J Psychiatry. Oct 19, 2022; 12(10): 1298-1312
Published online Oct 19, 2022. doi: 10.5498/wjp.v12.i10.1298
Published online Oct 19, 2022. doi: 10.5498/wjp.v12.i10.1298
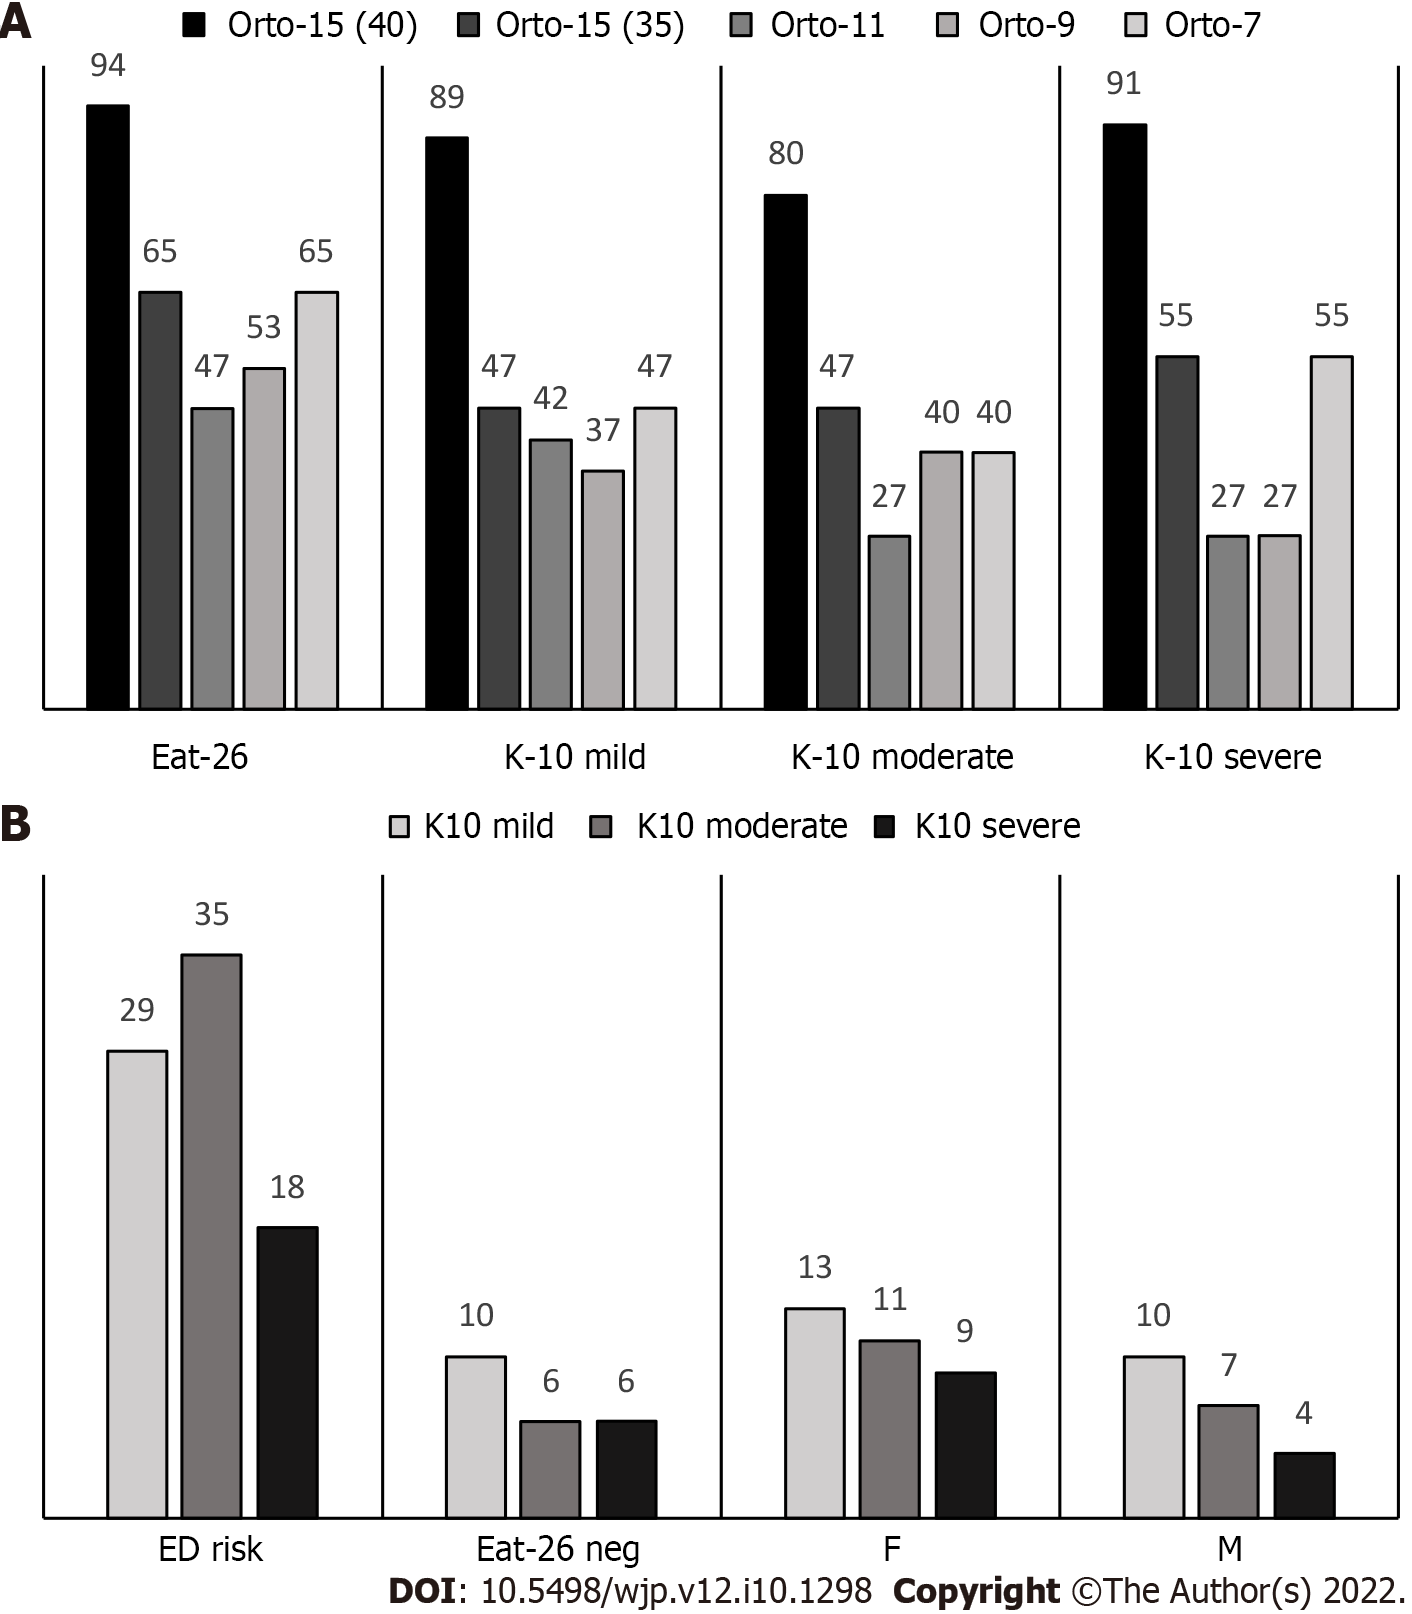
Figure 1 Prevalence of orthorexia nervosa.
A and B: Prevalence of orthorexia nervosa among students who presented an eating disorder (ED) risk [Eating Attitudes Test (EAT)-26] or psychological distress [Kessler Psychological Distress Scale (K10)] (A) and overlap of EAT-26 and K10 (B), in the whole sample. ORTO: Scores for orthorexia nervosa; K10: Kessler Psychological Distress Scale; EAT-26: Eating Attitudes Test; F: Italian and Spanish females; M: Italian and Spanish males; ED: Eating disorder.
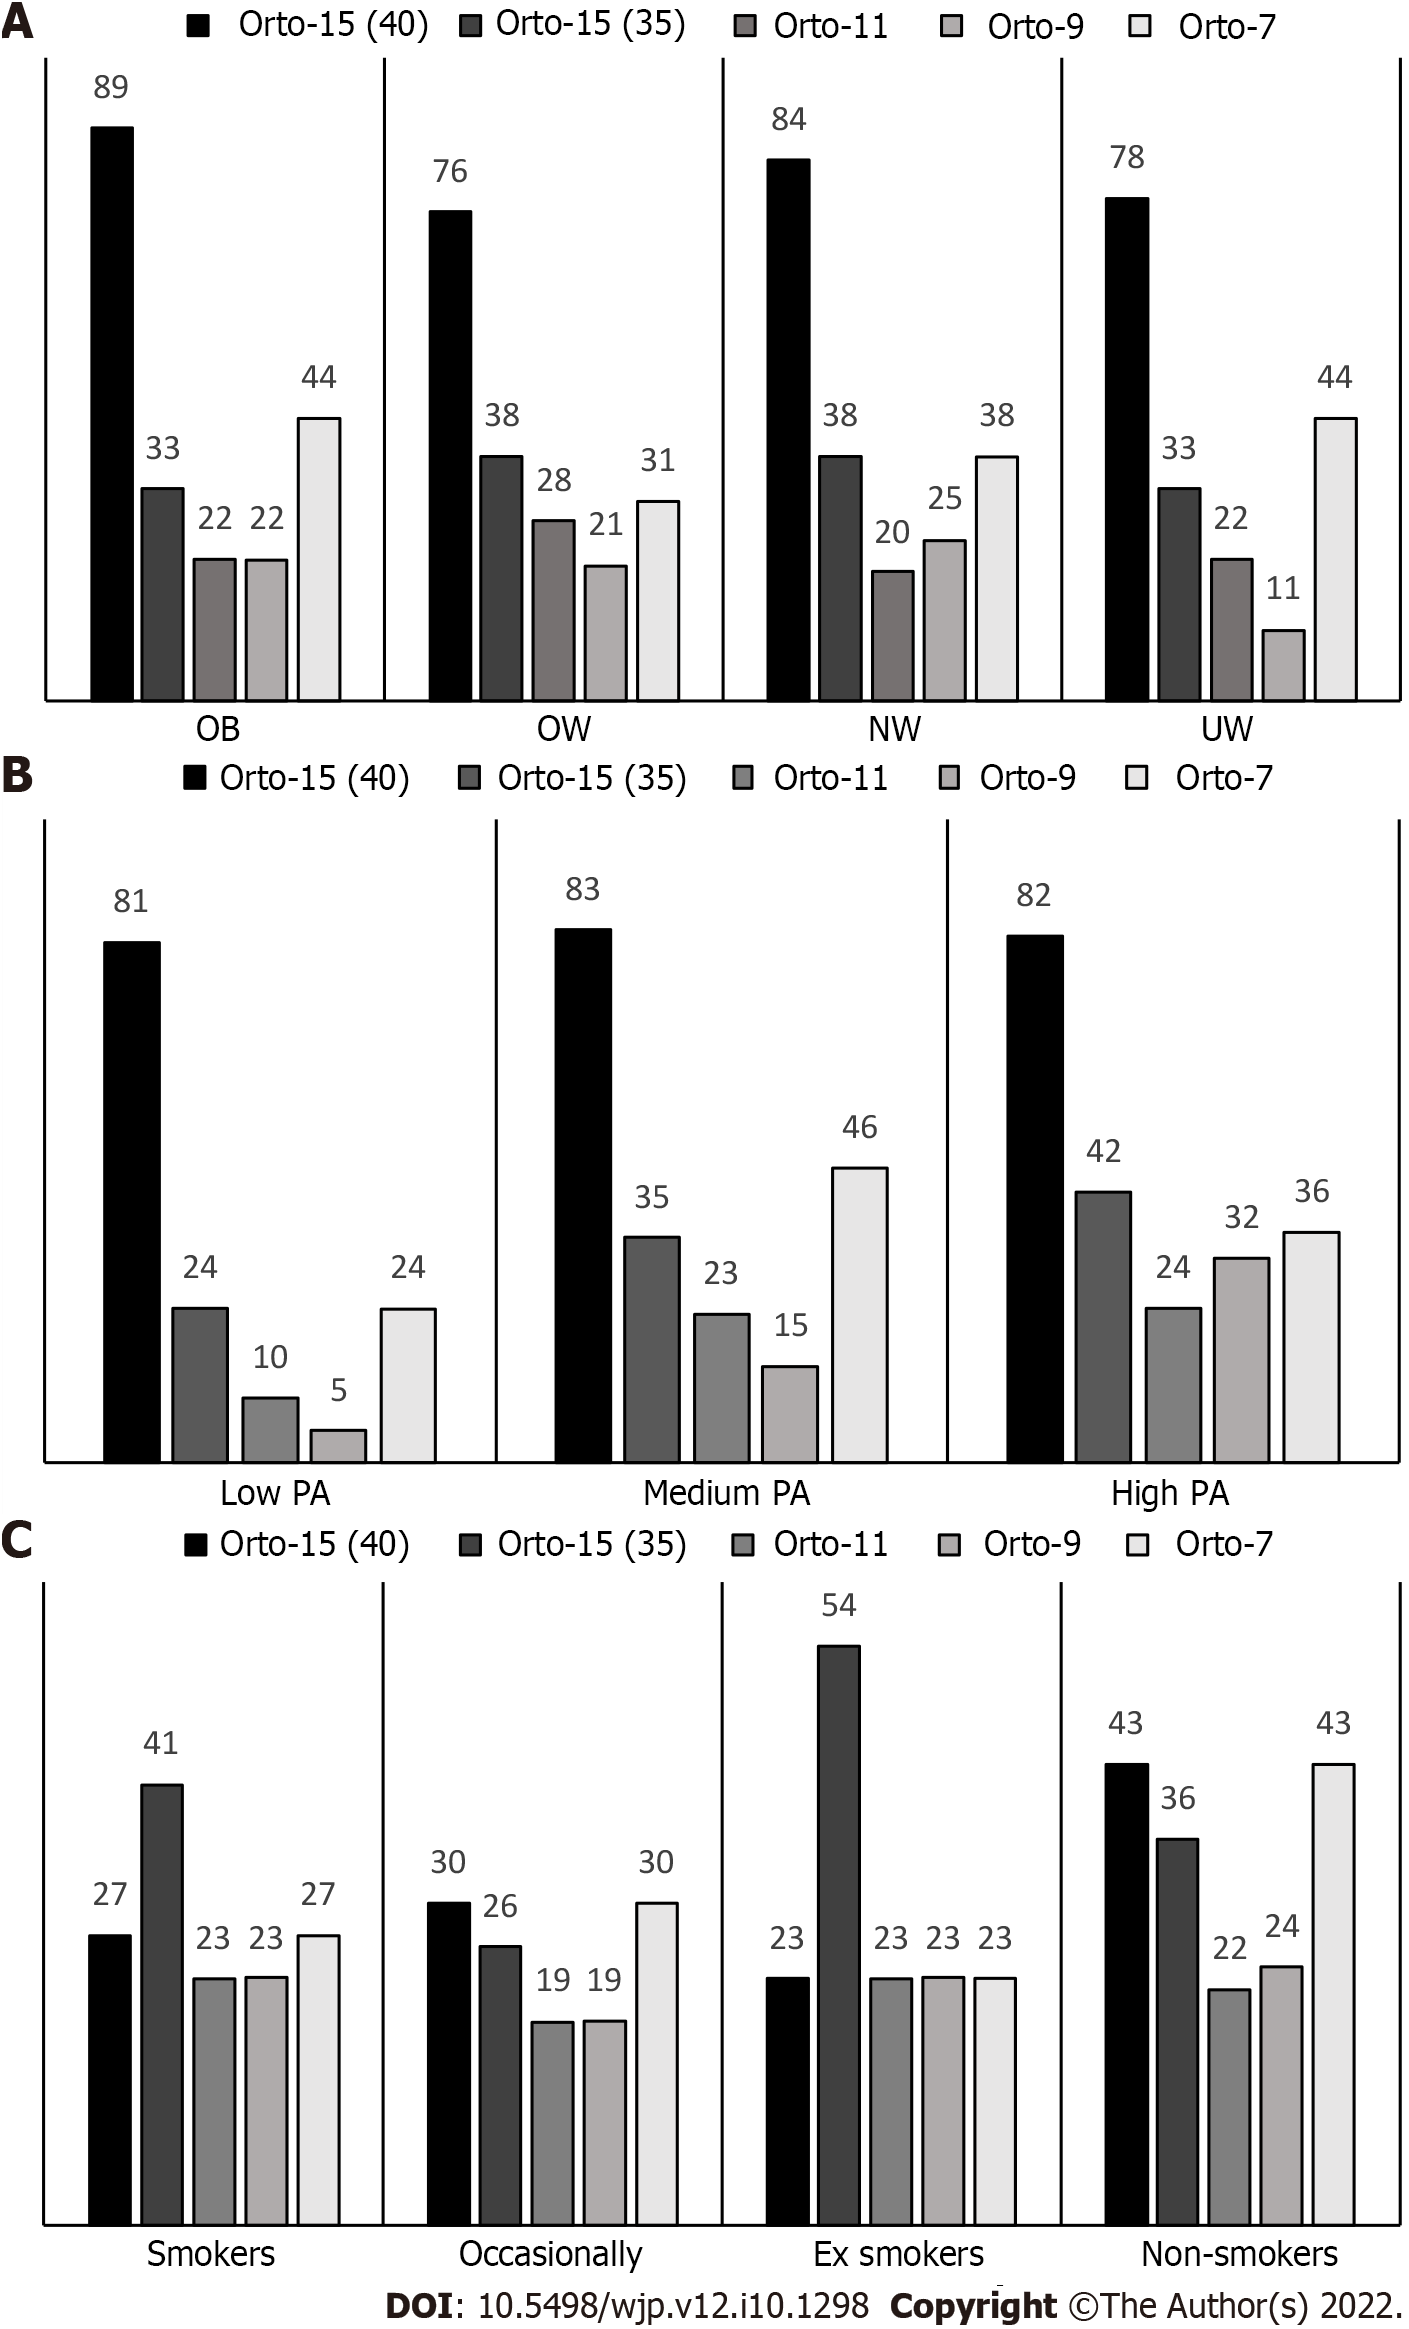
Figure 2 Prevalence of orthorexia nervosa among different body mass index classes and lifestyle factors.
A: Body mass index; B: Physical activity; C: Lifestyle factors. ORTO: Scores for orthorexia nervosa; OB: Obese; OW: Overweight; NW: Normal weight; UW: Underweight; PA: Physical activity.
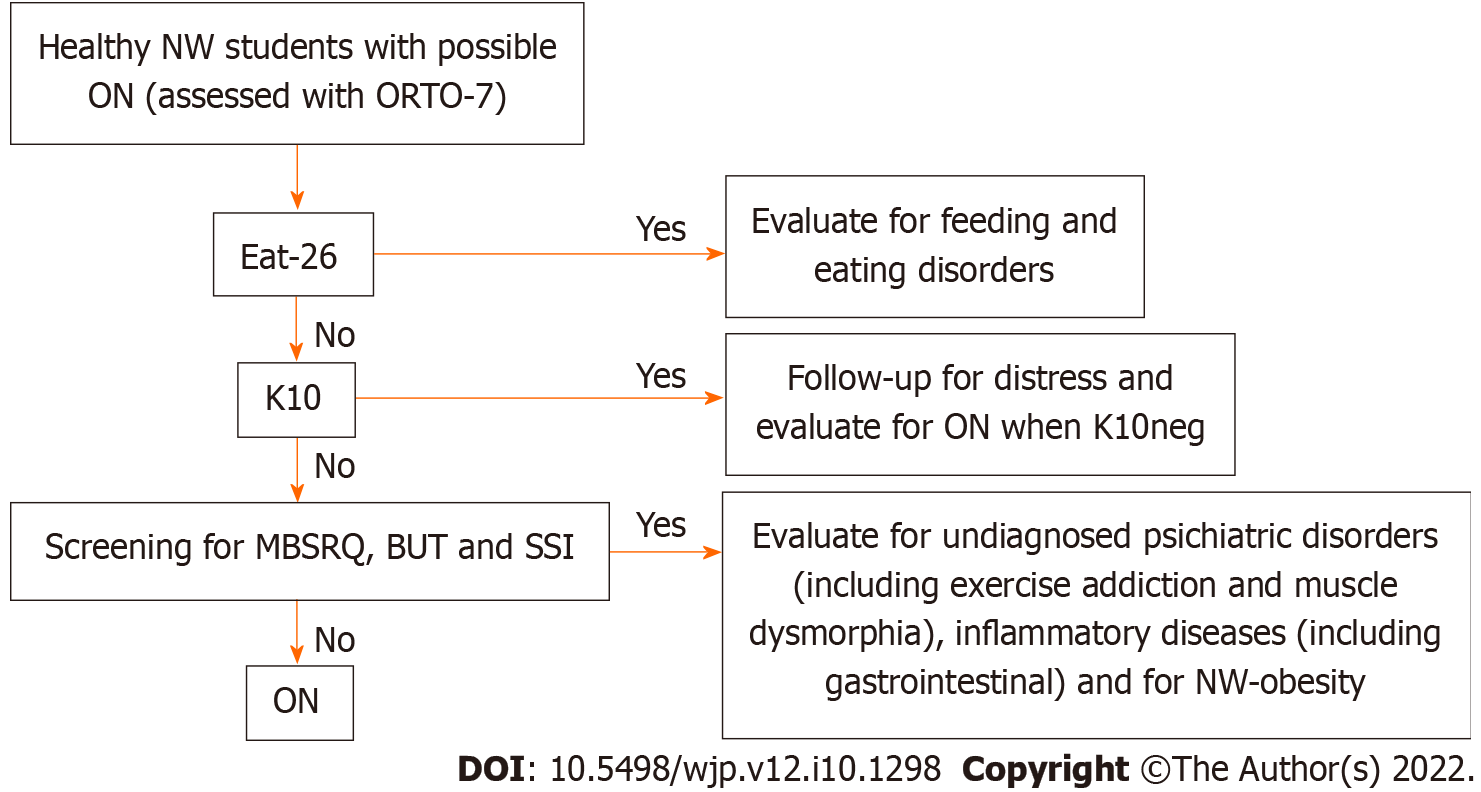
Figure 3 Decision tree for the exclusion diagnosis of orthorexia nervosa (ON) in healthy normal weight university students.
ORTO-7: Score for orthorexia nervosa; K10: Kessler Psychological Distress Scale; EAT-26: Eating Attitudes Test; MBSRQ: Multidimensional Body-Self Relations Questionnaire; BUT: Body Uneasiness Test; SSI: Starvation Symptom Inventory; NW: Normal weight.
- Citation: Aiello P, Toti E, Villaño D, Raguzzini A, Peluso I. Overlap of orthorexia, eating attitude and psychological distress in some Italian and Spanish university students. World J Psychiatry 2022; 12(10): 1298-1312
- URL: https://www.wjgnet.com/2220-3206/full/v12/i10/1298.htm
- DOI: https://dx.doi.org/10.5498/wjp.v12.i10.1298


