Copyright
©The Author(s) 2022.
World J Pharmacol. Nov 28, 2022; 11(3): 27-47
Published online Nov 28, 2022. doi: 10.5497/wjp.v11.i3.27
Published online Nov 28, 2022. doi: 10.5497/wjp.v11.i3.27
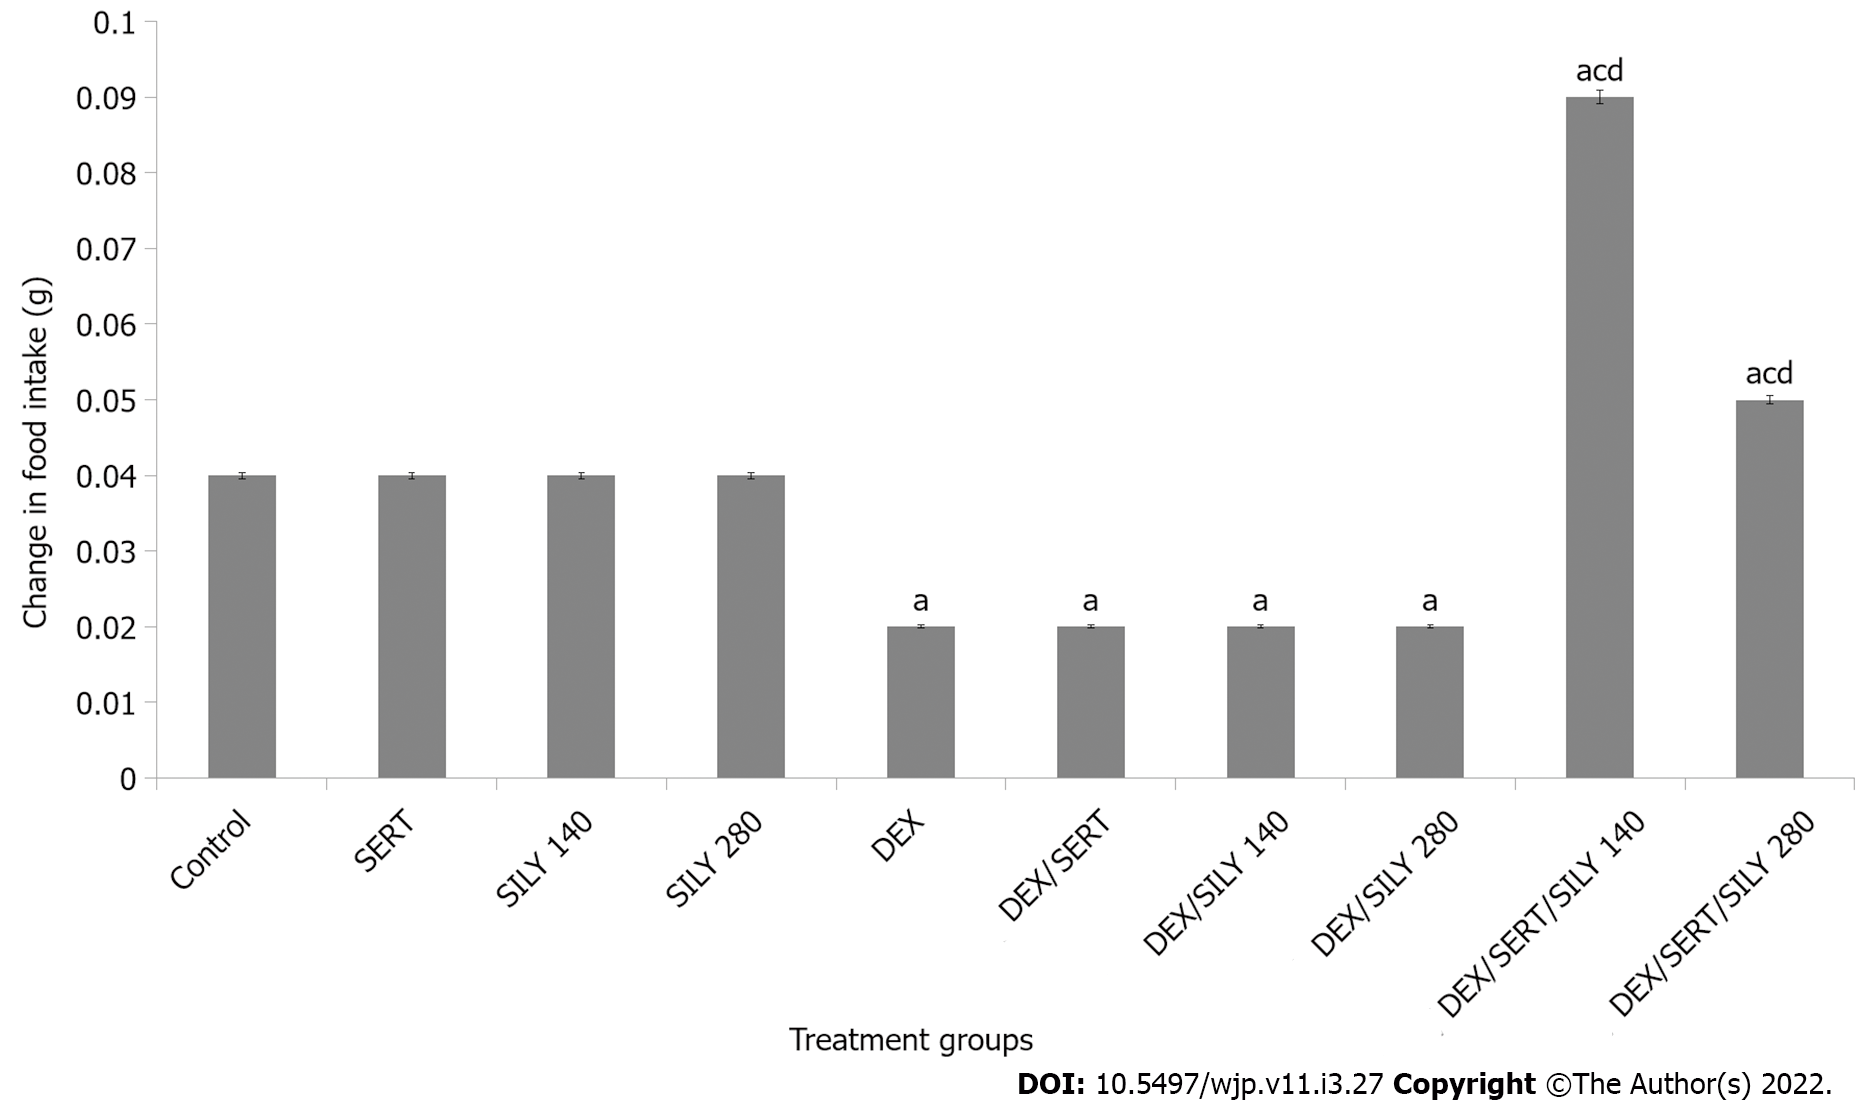
Figure 2 Effect of silymarin on changes in food intake.
Each bar represents the mean ± SEM, aP < 0.05 vs control, bP < 0.05 vs SERT, cP < 0.05 vs DEX, dP < 0.05 vs DEX/SERT. SERT: Sertraline; DEX: Dexamethasone; SILY: Silymarin. Number of mice per treatment group = 10.
- Citation: Onaolapo AY, Sulaiman H, Olofinnade AT, Onaolapo OJ. Antidepressant-like potential of silymarin and silymarin-sertraline combination in mice: Highlighting effects on behaviour, oxidative stress, and neuroinflammation. World J Pharmacol 2022; 11(3): 27-47
- URL: https://www.wjgnet.com/2220-3192/full/v11/i3/27.htm
- DOI: https://dx.doi.org/10.5497/wjp.v11.i3.27


