Copyright
©The Author(s) 2016.
World J Clin Infect Dis. May 25, 2016; 6(2): 6-21
Published online May 25, 2016. doi: 10.5495/wjcid.v6.i2.6
Published online May 25, 2016. doi: 10.5495/wjcid.v6.i2.6
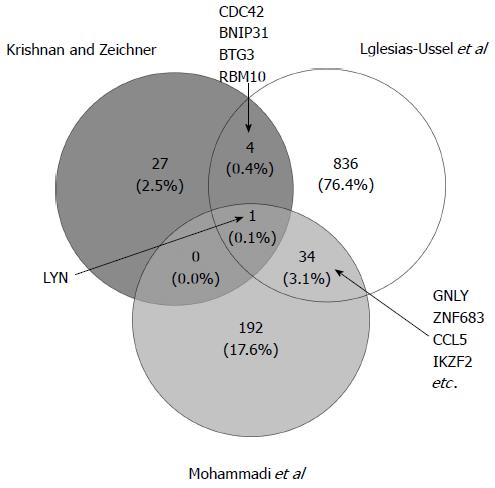
Figure 2 Venn diagram depicting differentially expressed genes across three latency models.
The overlapping genes were identified using the online tool Venny (http://bioinfogp.cnb.csic.es/tools/venny/index.html). Shown are the total number of differentially expressed genes and percent of total identified across all models[18,19,42]. For each overlap, gene symbols are listed. For the overlap between Iglesias-Ussel et al[19] and Mohammadi et al[42] studies, the four genes with the highest average absolute fold change are listed.
- Citation: White CH, Moesker B, Ciuffi A, Beliakova-Bethell N. Systems biology applications to study mechanisms of human immunodeficiency virus latency and reactivation. World J Clin Infect Dis 2016; 6(2): 6-21
- URL: https://www.wjgnet.com/2220-3176/full/v6/i2/6.htm
- DOI: https://dx.doi.org/10.5495/wjcid.v6.i2.6


