Copyright
©The Author(s) 2015.
World J Hypertens. May 23, 2015; 5(2): 41-52
Published online May 23, 2015. doi: 10.5494/wjh.v5.i2.41
Published online May 23, 2015. doi: 10.5494/wjh.v5.i2.41
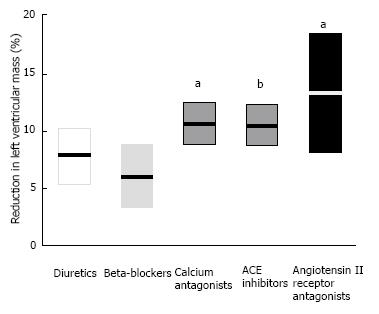
Figure 9 Change in left ventricular mass index (as percentage from baseline) with antihypertensive treatment by drug class.
Data represent the mean values and 95% confidence intervals, adjusted for change in diastolic blood pressure and treatment duration. The aP < 0.05 vs beta-blockers, and bP < 0.01 vs beta-blocker (after Bonferroni correction). ACE: Angiotensin-converting-enzyme. (Reproduced from Klingbeil et al[97], 2003).
- Citation: Kuroda K, Kato TS, Amano A. Hypertensive cardiomyopathy: A clinical approach and literature review. World J Hypertens 2015; 5(2): 41-52
- URL: https://www.wjgnet.com/2220-3168/full/v5/i2/41.htm
- DOI: https://dx.doi.org/10.5494/wjh.v5.i2.41


