Copyright
©2014 Baishideng Publishing Group Co.
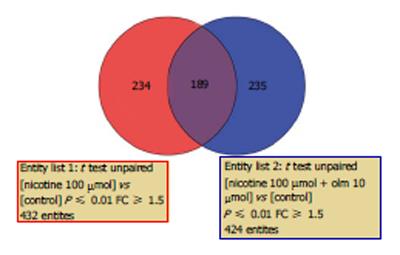
Figure 2 Venn diagrams demonstrating the results of comparing two datasets (100 μmol/L nicotine and 100 μmol/L nicotine plus 10 μmol/L olmesartan, compared to untreated cells, respectively).
There were 189 genes in common in the two data sets. Red circle: Nicotine; Blue circle: Nicotine plus olmesartan. These data represent the unique genes that were modified by their respective treatments. Oml: Olmesartan.
- Citation: Kudo M, Matsuda K, Sugawara K, Iki Y, Kogure N, Saito-Ito T, Shimizu K, Sato I, Yoshikawa T, Uruno A, Ito R, Yokoyama A, Saito-Hakoda A, Ito S, Sugawara A. ARB affects nicotine-induced gene expression profile in human coronary artery endothelial cells. World J Hypertens 2014; 4(1): 7-14
- URL: https://www.wjgnet.com/2220-3168/full/v4/i1/7.htm
- DOI: https://dx.doi.org/10.5494/wjh.v4.i1.7


