
















©The Author(s) 2025.
World J Exp Med. Sep 20, 2025; 15(3): 105208
Published online Sep 20, 2025. doi: 10.5493/wjem.v15.i3.105208
Published online Sep 20, 2025. doi: 10.5493/wjem.v15.i3.105208
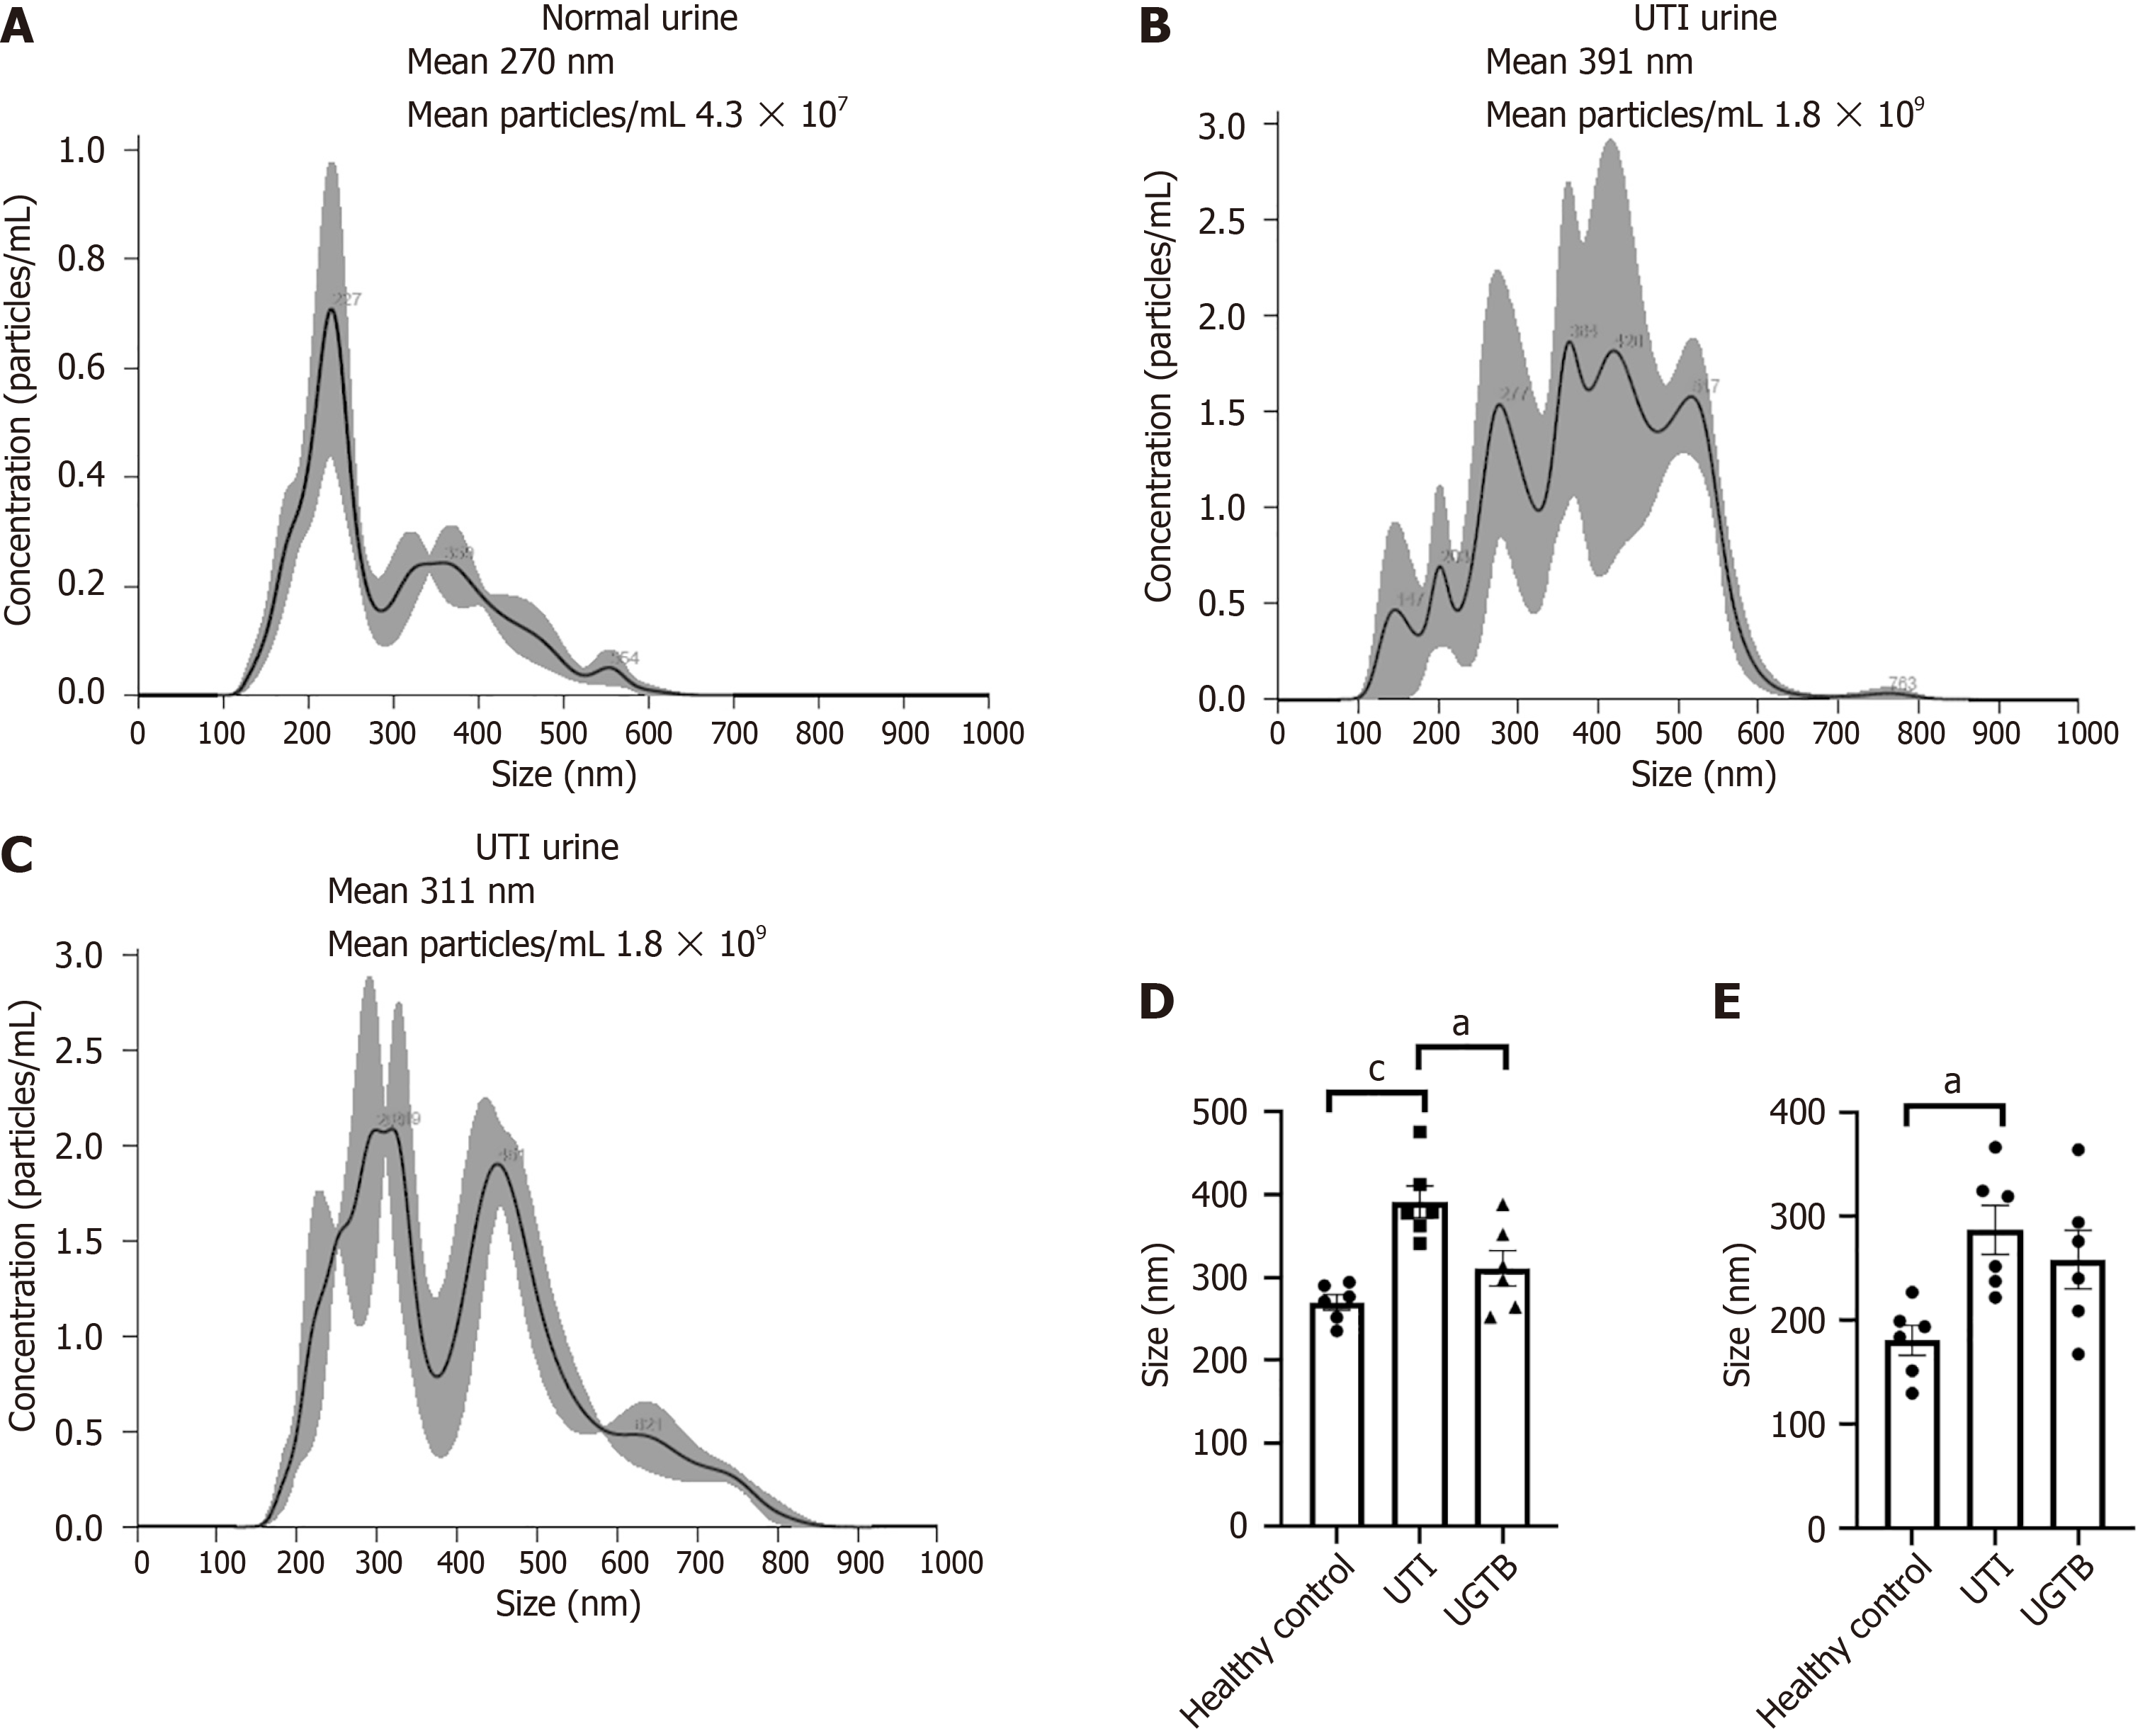
Figure 1 Urinary extracellular vesicles characterization representative nanoparticle tracking analysis plots of urinary extracellular vesicles showing mean size and mean exosome concentration (particles/mL)/size in pellet.
aP value < 0.05; cP value < 0.001. Statistical significance calculated using one-way analysis of variance test (n = 6/group). A: Normal urine; B: Urinary tract infections urine; C: Urogenital tuberculosis urine; D: Histogram depicting the nanoparticle tracking analysis mean; E: Histogram depicting the nanoparticle tracking analysis mode. UTI: Urinary tract infections; UGTB: Urogenital tuberculosis.
- Citation: Das P, Chaudhary DK, Mishra R, Tiwari S. Evaluation of urinary extracellular vesicles and microRNAs to diagnose urogenital tuberculosis. World J Exp Med 2025; 15(3): 105208
- URL: https://www.wjgnet.com/2220-315X/full/v15/i3/105208.htm
- DOI: https://dx.doi.org/10.5493/wjem.v15.i3.105208