Copyright
©The Author(s) 2025.
World J Exp Med. Sep 20, 2025; 15(3): 103948
Published online Sep 20, 2025. doi: 10.5493/wjem.v15.i3.103948
Published online Sep 20, 2025. doi: 10.5493/wjem.v15.i3.103948
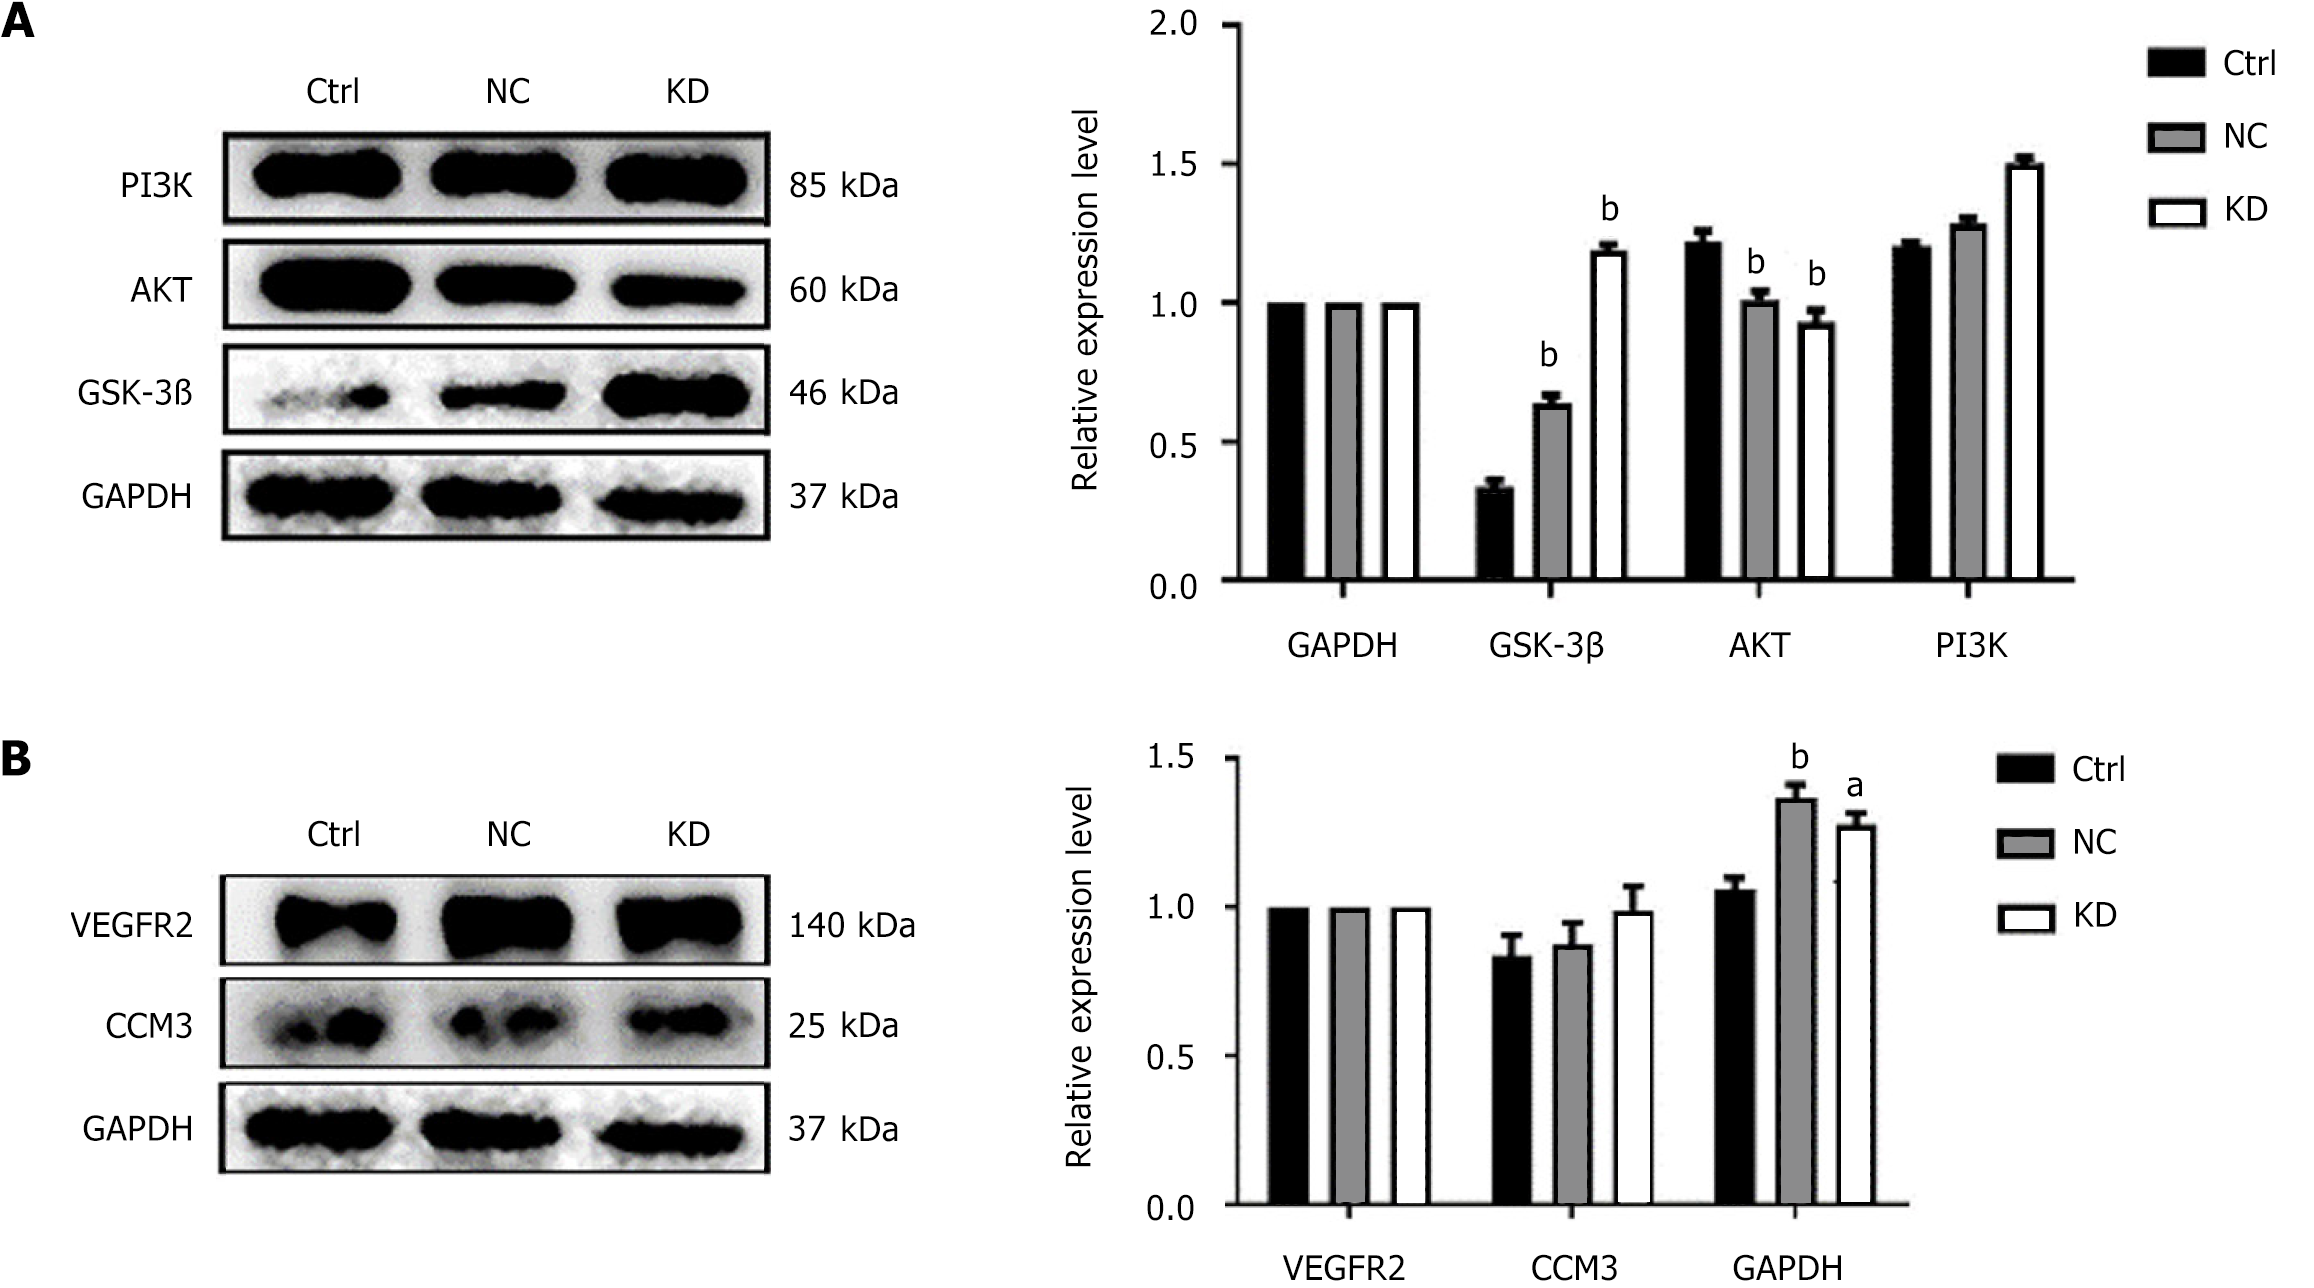
Figure 2 PI3K/AKT/GSK3β regulatory axis and ferroptosis-related proteins expression and quantitative results of bones mesenchymal stem cells.
A: PI3K, AKT and GSK3β WB blots and Grayscale quantitative results with image of bones mesenchymal stem cells (BMCs); B: VEGFR2 and CCM3 WB blots and Grayscale quantitative results with Image of BMCs. aP < 0.05, bP < 0.01 vs the control group; KD: Knockdown; NC: Empty plasmid control.
- Citation: Gao N, Wu PF, Wu MW, Li YM, Liang X, Wang FF, Li XJ, Shen QQ, Zheng TP, Liu XL, Sun Y, Yang LX. PI3K/AKT/GSK3β regulatory axis in bone mesenchymal stem cells initiates diabetic myocardial infarction via miR-142-3p. World J Exp Med 2025; 15(3): 103948
- URL: https://www.wjgnet.com/2220-315X/full/v15/i3/103948.htm
- DOI: https://dx.doi.org/10.5493/wjem.v15.i3.103948


