Copyright
©The Author(s) 2016.
World J Crit Care Med. May 4, 2016; 5(2): 150-164
Published online May 4, 2016. doi: 10.5492/wjccm.v5.i2.150
Published online May 4, 2016. doi: 10.5492/wjccm.v5.i2.150
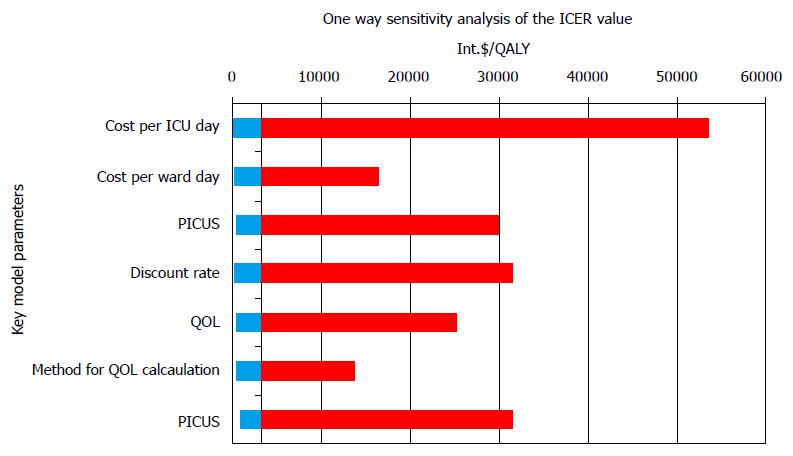
Figure 7 Variations of incremental cost effectiveness ratio values in the one way sensitivity analysis.
The values are given in International dollar. The highest variations in ICER values and consequently the impact on ICER values had cost per ICU day, followed with post ICU survival rate and discount rate. ICU: Intensive care unit; PICUS: Post ICU survival; QOL: Quality of life; ICER: Incremental cost effectiveness ratio.
- Citation: Cubro H, Somun-Kapetanovic R, Thiery G, Talmor D, Gajic O. Cost effectiveness of intensive care in a low resource setting: A prospective cohort of medical critically ill patients. World J Crit Care Med 2016; 5(2): 150-164
- URL: https://www.wjgnet.com/2220-3141/full/v5/i2/150.htm
- DOI: https://dx.doi.org/10.5492/wjccm.v5.i2.150


