Copyright
©The Author(s) 2015.
World J Crit Care Med. Feb 4, 2015; 4(1): 1-12
Published online Feb 4, 2015. doi: 10.5492/wjccm.v4.i1.1
Published online Feb 4, 2015. doi: 10.5492/wjccm.v4.i1.1
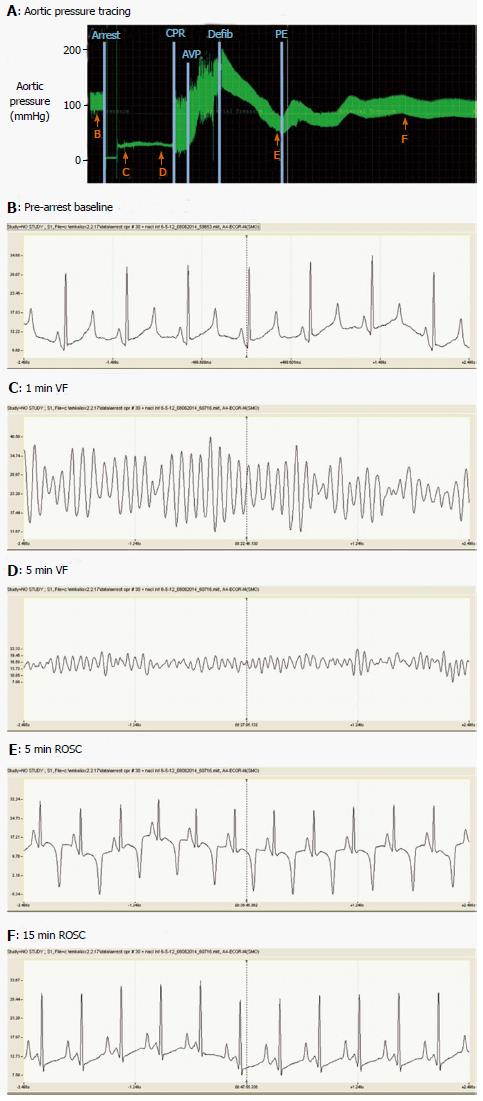
Figure 2 Aortic pressures and lead IIelectrocardiogram during cardiac arrest, cardiopulmonary resuscitation and recovery of spontaneous circulation.
A: Phasic aortic pressure tracing during the period from pre-arrest baseline to 20 min ROSC. Lettered arrows indicate times at which the electrocardiograms shown in panels B-F were obtained. Vertical lines indicate: (1) induction of ventricular fibrillation cardiac arrest; (2) commencement of precordial compressions (CPR); (3) injection of vasopressin (AVP); (4) defibrillation (Defib) by 200 J countershock; and (5) initiation of intravenous phenylephrine (PE; c. 2 μg/kg per minute) to stabilize systemic arterial pressure during ROSC. Mechanical ventilation was suspended during cardiac arrest and CPR. Panels B-F show 5 s electrocardiographic recordings. CPR: Cardiopulmonary resuscitation; ROSC: Recovery of spontaneous circulation; AVP: Vasopressin; PE: Phenylephrine.
- Citation: Cherry BH, Nguyen AQ, Hollrah RA, Olivencia-Yurvati AH, Mallet RT. Modeling cardiac arrest and resuscitation in the domestic pig. World J Crit Care Med 2015; 4(1): 1-12
- URL: https://www.wjgnet.com/2220-3141/full/v4/i1/1.htm
- DOI: https://dx.doi.org/10.5492/wjccm.v4.i1.1


