
















Copyright: ©Author(s) 2026.
World J Crit Care Med. Sep 9, 2026; 15(3): 119925
Published online Sep 9, 2026. doi: 10.5492/wjccm.119925
Published online Sep 9, 2026. doi: 10.5492/wjccm.119925
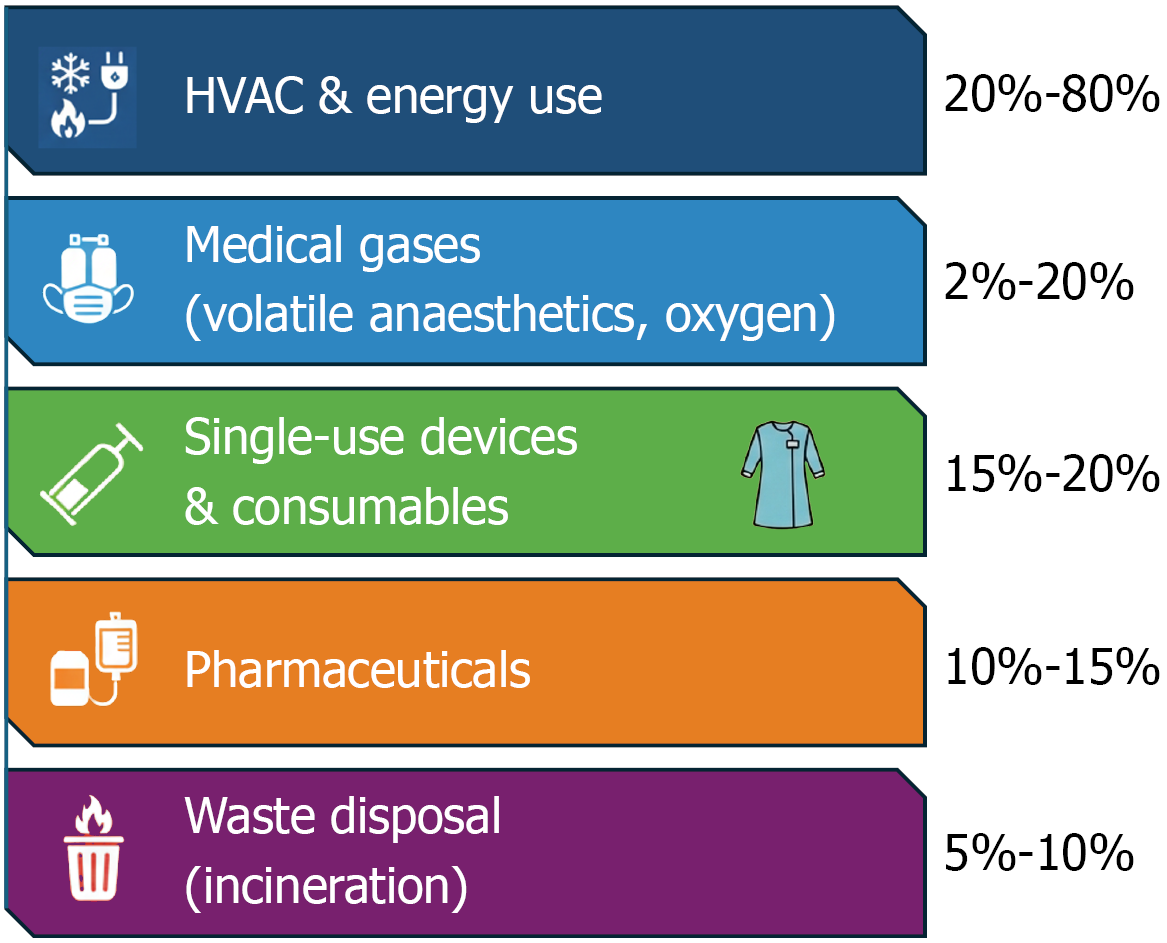
Figure 2 Carbon hotspots in the intensive care unit.
Approximate contribution of major emission sources to the total intensive care unit (ICU) carbon footprint, based on published healthcare life-cycle assessment and sustainability reports. Energy use-predominantly heating, ventilation, and air conditioning systems-accounts for the largest share, followed by medical gases, single-use devices and consumables, pharmaceuticals, and waste disposal. Ranges are illustrative as they are derived from heterogeneous studies with different system boundaries, energy mixes, allocation methods, and included emission categories; they should not be interpreted as components of a single universal ICU carbon-footprint profile. HVAC: Heating, ventilation and air conditioning.
- Citation: Goel S, Kataria S, Juneja D. From carbon cost to climate care: Greening our intensive care units. World J Crit Care Med 2026; 15(3): 119925
- URL: https://www.wjgnet.com/2220-3141/full/v15/i3/119925.htm
- DOI: https://dx.doi.org/10.5492/wjccm.119925