
















Copyright: ©Author(s) 2026.
World J Crit Care Med. Sep 9, 2026; 15(3): 119057
Published online Sep 9, 2026. doi: 10.5492/wjccm.119057
Published online Sep 9, 2026. doi: 10.5492/wjccm.119057
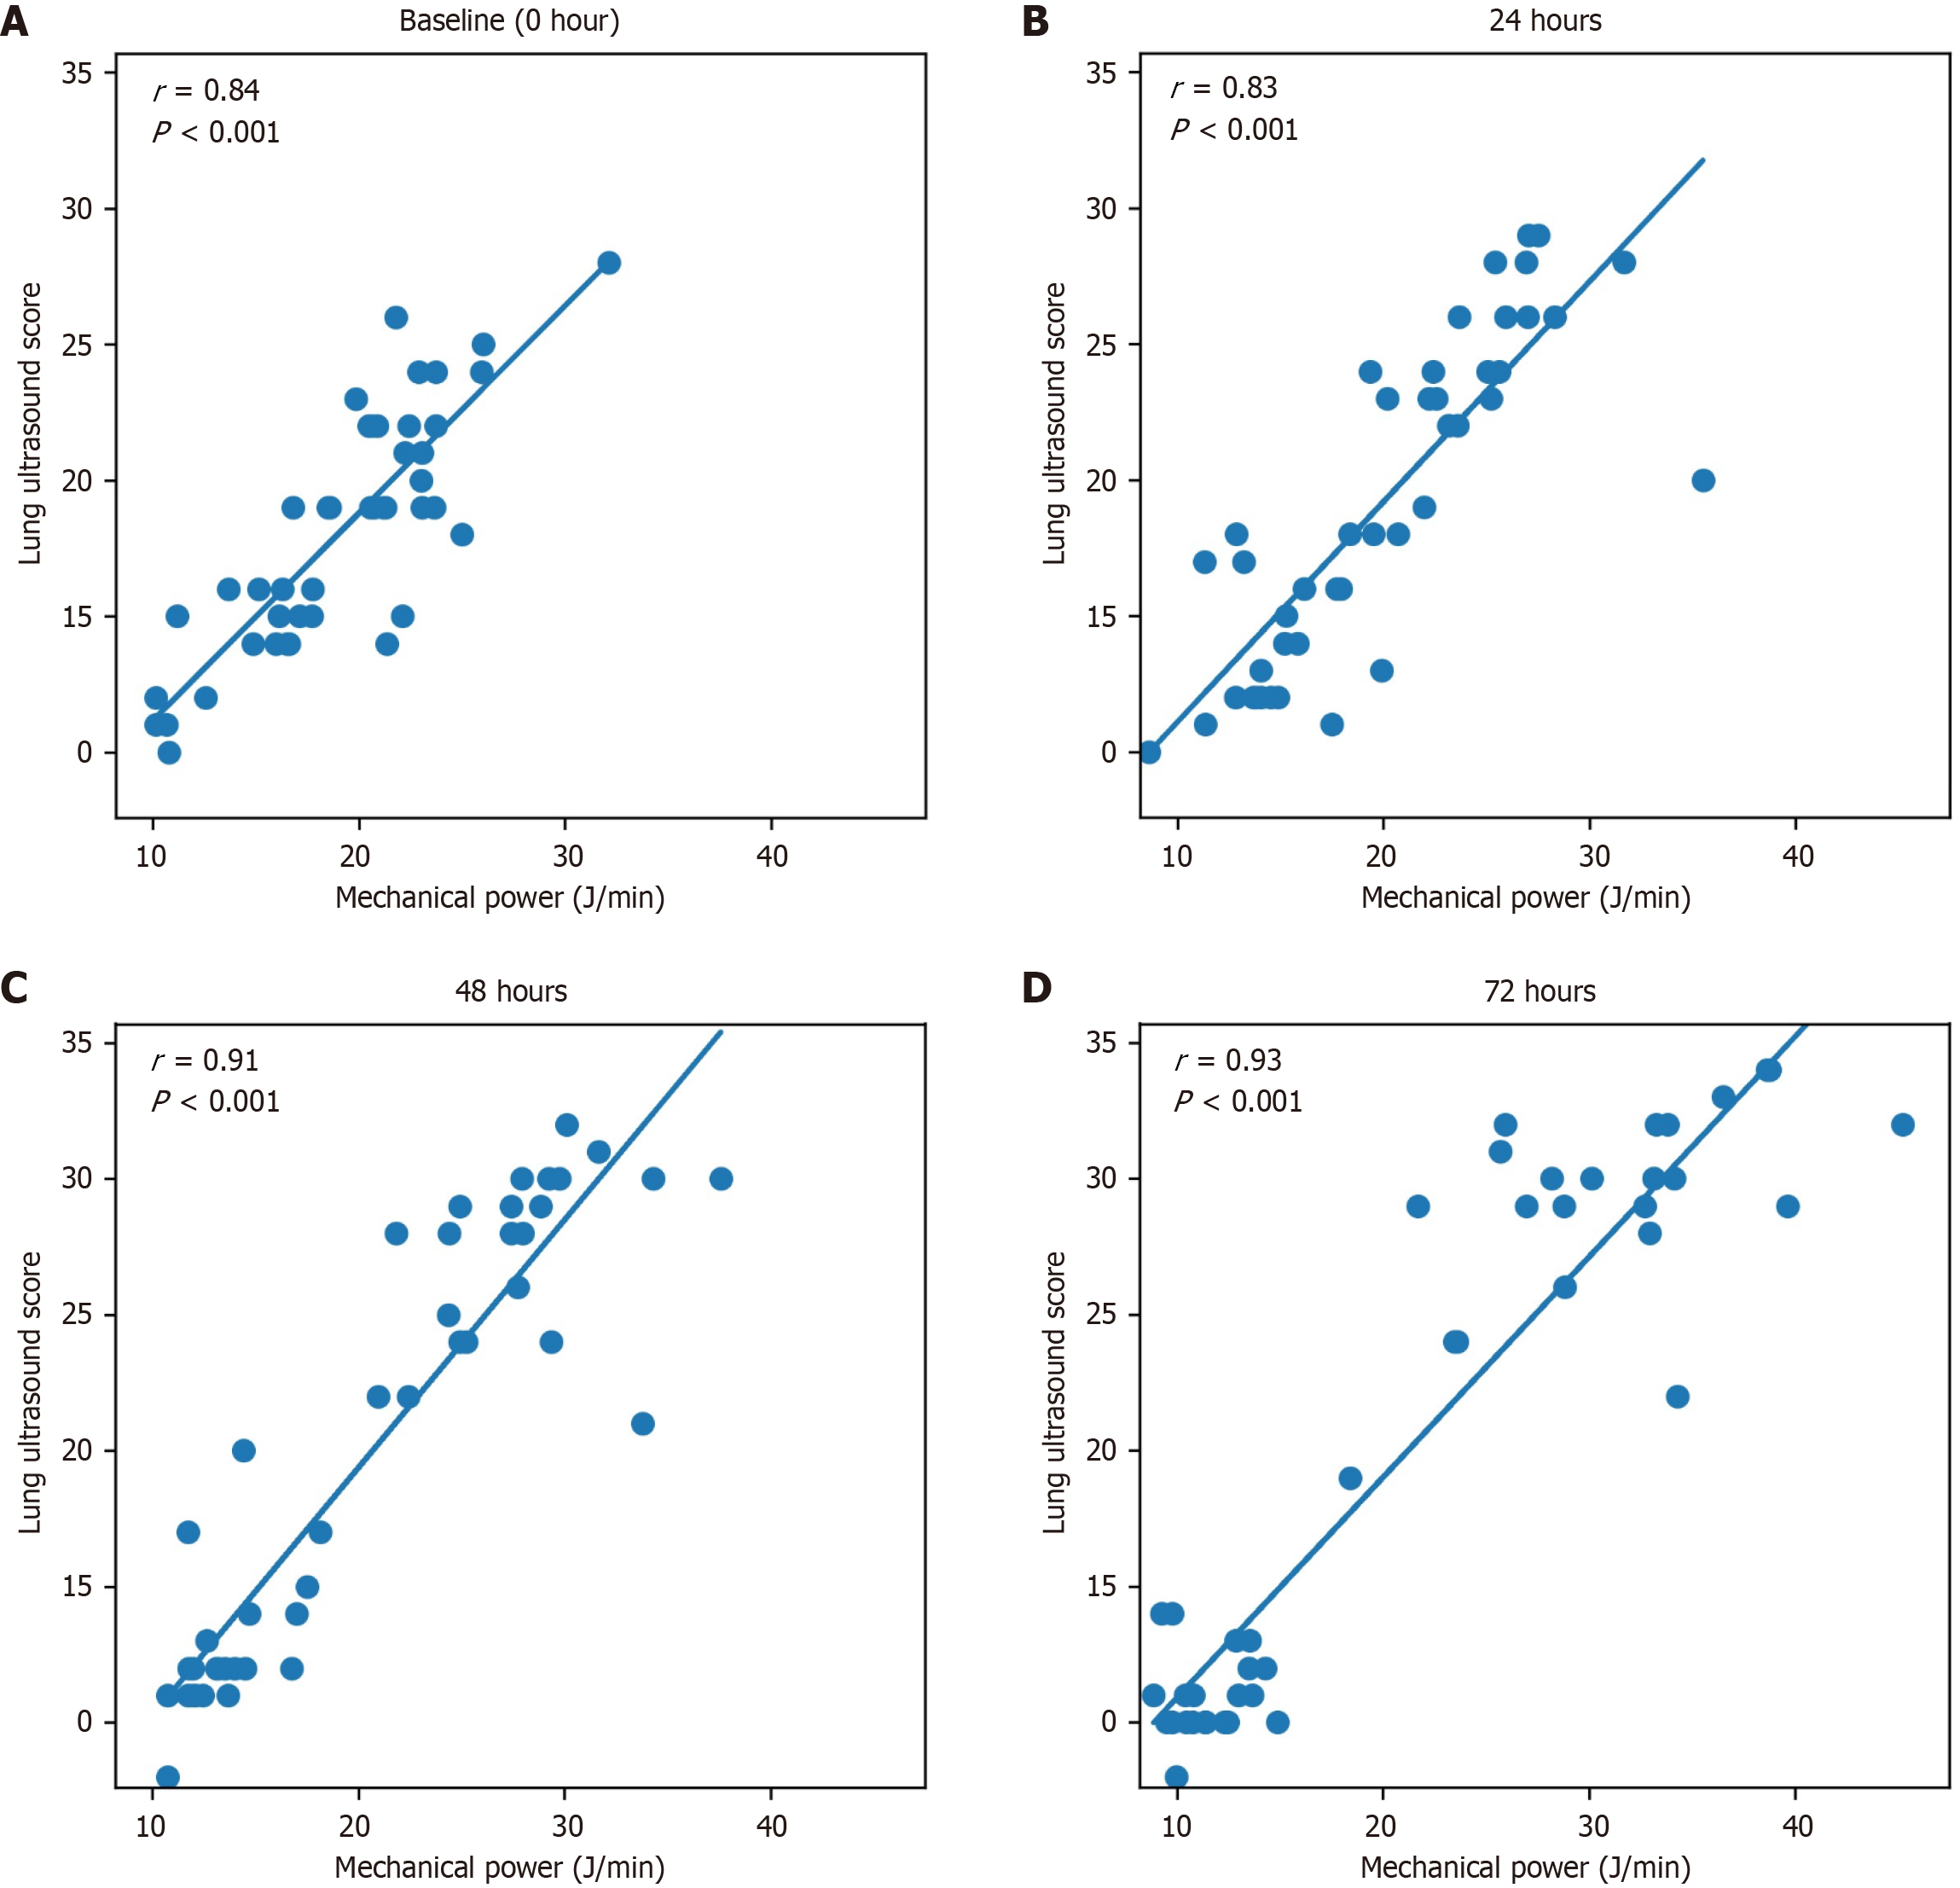
Figure 2 Scatter plots showing the association between mechanical power and lung ultrasound score at predefined time points.
A: Baseline; B: 24 hours; C: 48 hours; D: 72 hours. Pearson correlation coefficients (r) and two-tailed P values are shown. All correlations were based on the complete cohort (n = 44) at each time point.
- Citation: Mathen PG, Sharma N, Nair RS, Valiyaparambath A, Kaur H, Gupta A, Sharma R, Pannu AK. Correlation between mechanical power and lung ultrasound score and association with clinical outcomes in acute respiratory distress syndrome. World J Crit Care Med 2026; 15(3): 119057
- URL: https://www.wjgnet.com/2220-3141/full/v15/i3/119057.htm
- DOI: https://dx.doi.org/10.5492/wjccm.119057