
















Copyright: ©Author(s) 2026.
World J Crit Care Med. Jun 9, 2026; 15(2): 114240
Published online Jun 9, 2026. doi: 10.5492/wjccm.v15.i2.114240
Published online Jun 9, 2026. doi: 10.5492/wjccm.v15.i2.114240
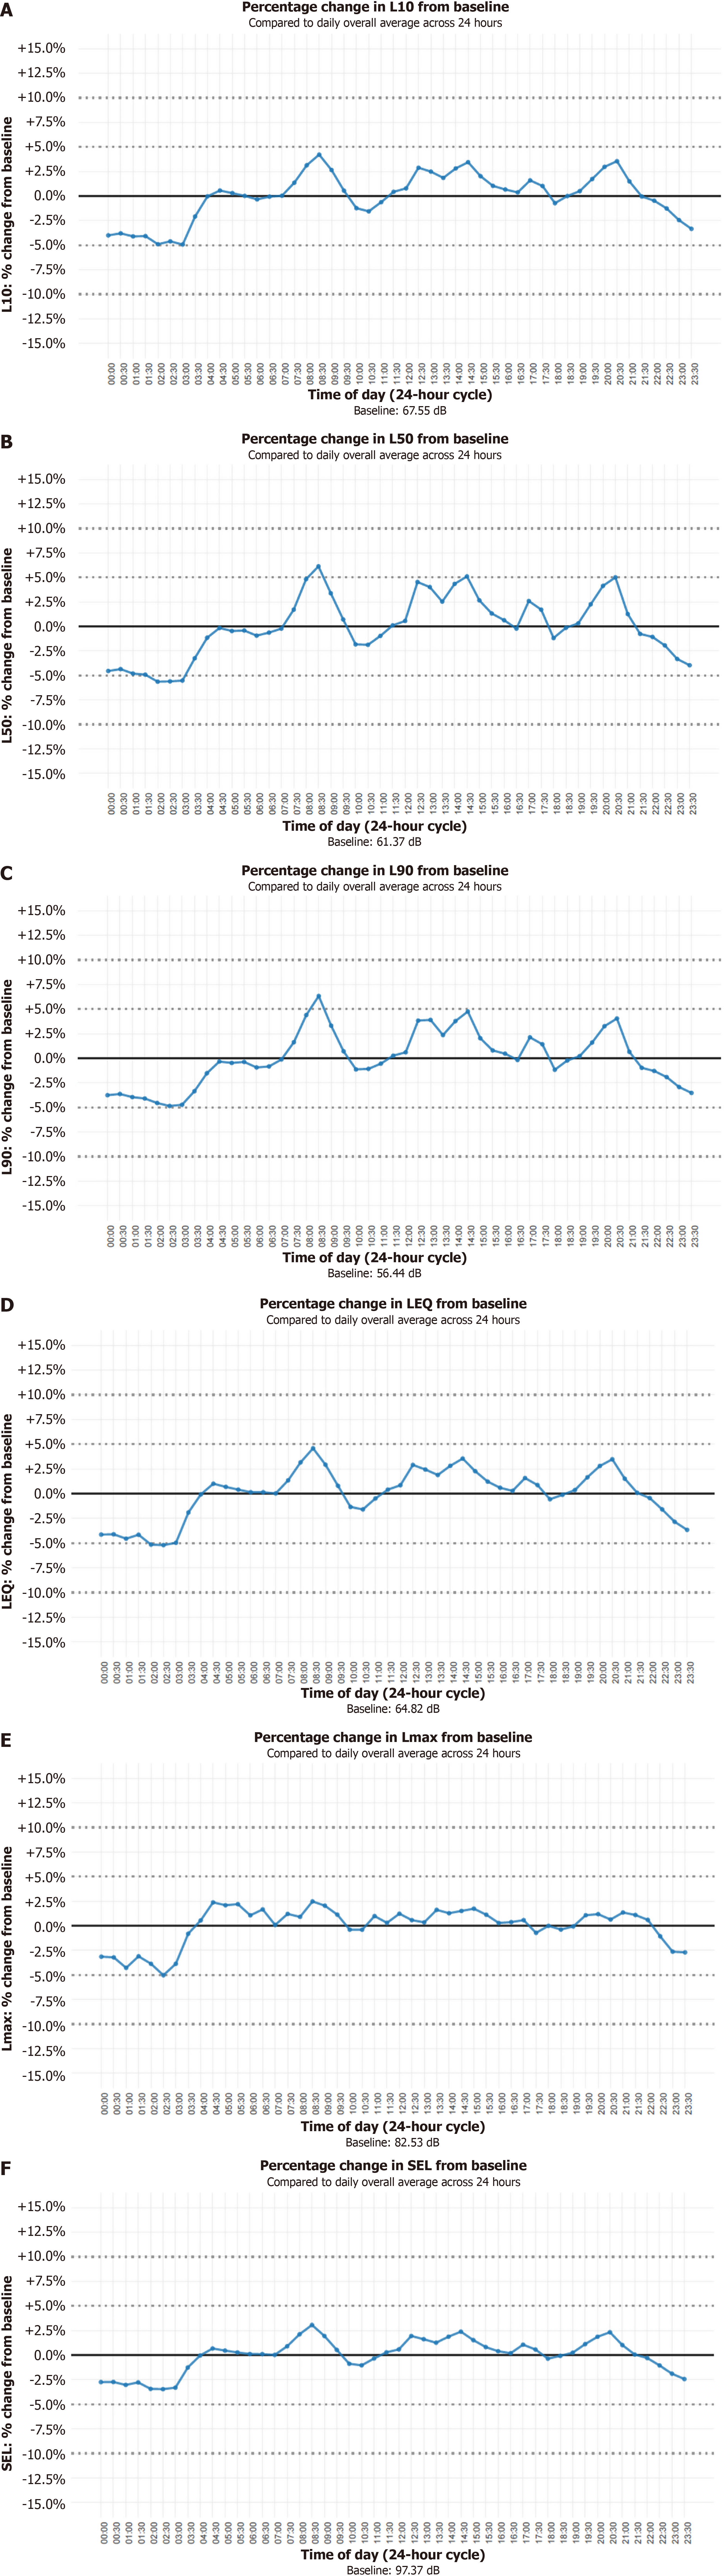
Figure 2 Diurnal variation in L10, L50, L90 (representing sound levels exceeding 10%, 50%, and 90% of the time, respectively), equivalent continuous noise level, maximum sound level and sound exposure level (Baseline values were defined as the overall mean during stable periods; percentage change reflects deviation relative to baseline).
A: L10 - noise levels exceeded for 10% of the time; B: L50 - noise levels exceeded for 50% of the time; C: L90 - noise levels exceeded for 90% of the time; D: Equivalent continuous noise level. The average sound energy over a given time period; E: The highest sound level recorded during the measurement period; F: Sound exposure level is the total energy of a sound event, normalized to 1 second. L10, L50, L90: Representing sound levels exceeding 10%, 50%, and 90% of the time, respectively; LEQ: Equivalent continuous noise level; Lmax: Maximum sound level; SEL: Sound exposure level.
- Citation: Gupta R, Chadha AS, Lakra H, Rehan R, Kalra R, Ray S. Noise quantification in the intensive care unit of a tertiary care hospital. World J Crit Care Med 2026; 15(2): 114240
- URL: https://www.wjgnet.com/2220-3141/full/v15/i2/114240.htm
- DOI: https://dx.doi.org/10.5492/wjccm.v15.i2.114240