
















©Author(s) (or their employer(s)) 2026.
World J Crit Care Med. Mar 9, 2026; 15(1): 114318
Published online Mar 9, 2026. doi: 10.5492/wjccm.v15.i1.114318
Published online Mar 9, 2026. doi: 10.5492/wjccm.v15.i1.114318
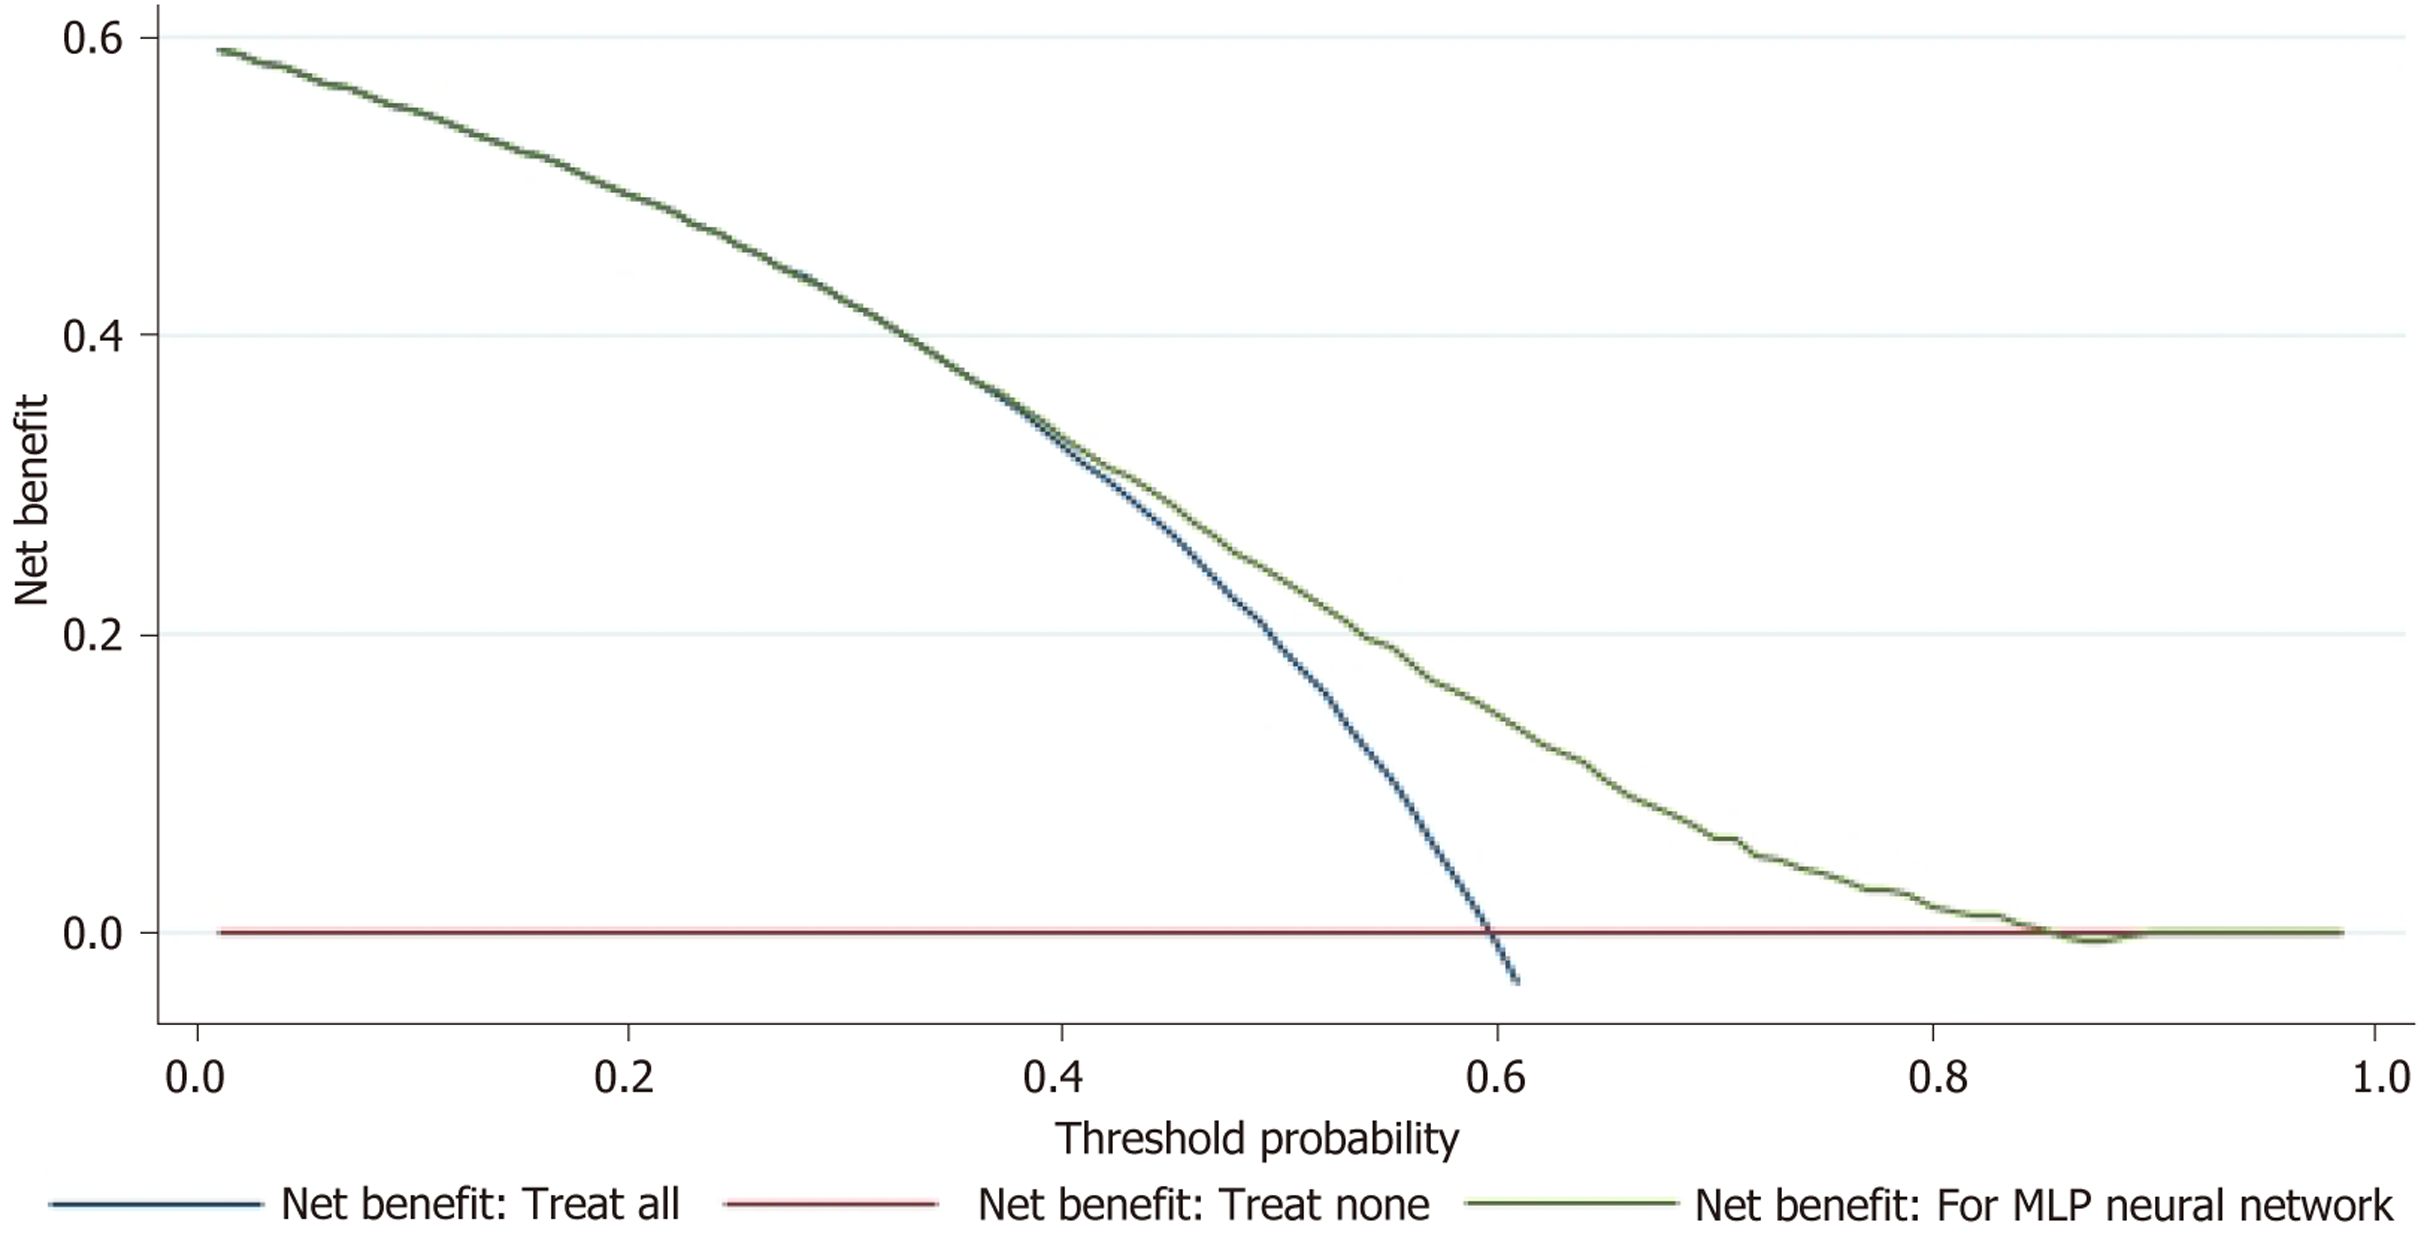
Figure 9 Decision curve analysis of the multilayer perceptron neural network.
Decision curve analysis showing net benefit vs threshold probability. The blue curve (treat-all) decreases from 0.6 at threshold 0 to 0 at 0.6. The red line (treat-none) remains at 0 across thresholds 0-0.8. The green curve (multilayer perceptron) starts near 0.6 and declines toward 0 as the threshold increases to 0.8, while maintaining higher net benefit than both reference strategies across most of the range. This indicates superior clinical utility of the multilayer perceptron model across commonly used decision thresholds.
- Citation: Rajendran J, Ang SP, Lorenzo-Capps MJ, Valladares C, Lee E, Bommu VJL, Altarcha G, Pominov S, Gregory B, Chia JE, Iglesias J. Predicting acute kidney injury in septic shock patients using inflammatory indices in the intensive care unit. World J Crit Care Med 2026; 15(1): 114318
- URL: https://www.wjgnet.com/2220-3141/full/v15/i1/114318.htm
- DOI: https://dx.doi.org/10.5492/wjccm.v15.i1.114318