Copyright
©The Author(s) 2025.
World J Crit Care Med. Sep 9, 2025; 14(3): 101462
Published online Sep 9, 2025. doi: 10.5492/wjccm.v14.i3.101462
Published online Sep 9, 2025. doi: 10.5492/wjccm.v14.i3.101462
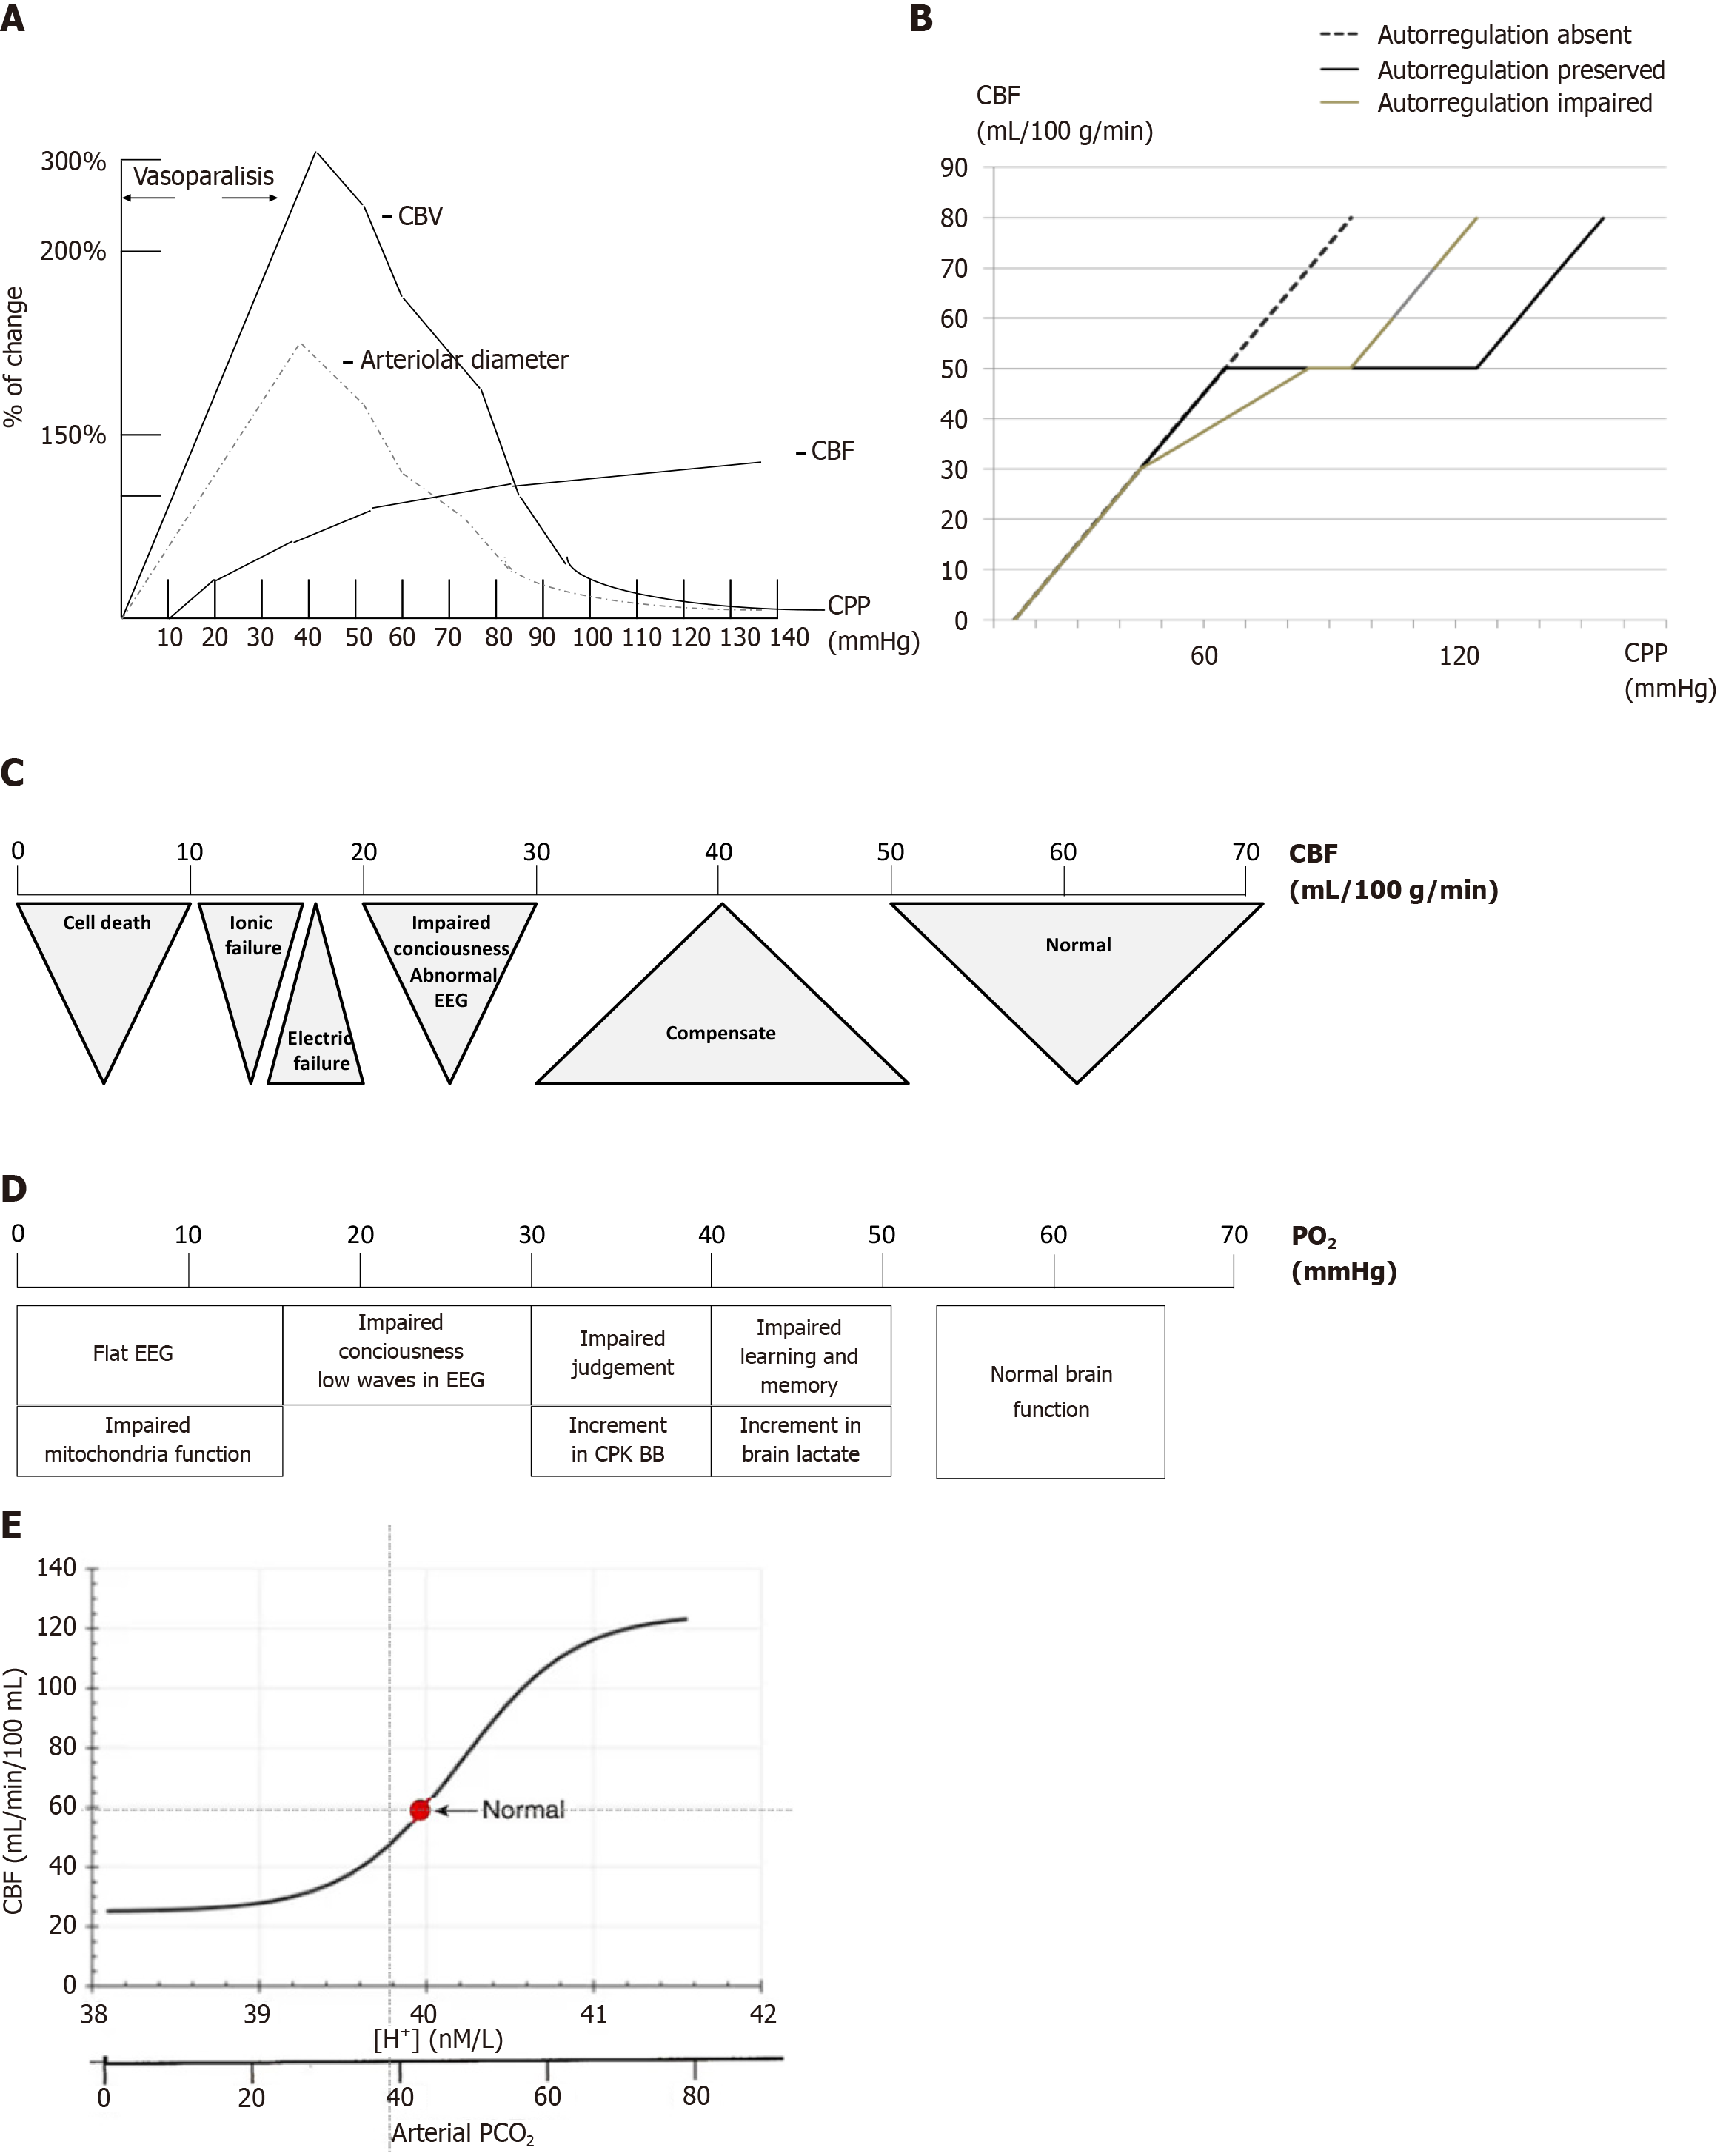
Figure 2 Relationship between cerebral blood flow and cerebral perfusion pressures.
A: Solid line represents preserved autoregulation, dashed line represents impaired autoregulation, and dotted line represents abolished autoregulation. Note that both altered and abolished autoregulation require higher cerebral perfusion pressures to maintain adequate cerebral blood flow; B: Relative changes in cerebral blood volume, vascular diameter, and cerebral blood flow in response to changes in cerebral perfusion pressures; C: Cerebral blood flow thresholds. The critical threshold for cellular death is below 10 mL/100 g/minute; D: Hypoxic thresholds. Clinical neurological signs emerge only at significantly low partial oxygen levels (below 40 mmHg); E: A typical graph illustrating this relationship places cerebral blood flow on the y-axis and partial carbon dioxide pressure and pH on the x-axis. As partial carbon dioxide pressure and H+ concentrations increase, cerebral blood flow (CBF) rises sharply until it reaches a plateau, beyond which further increases have a diminishing impact on CBF. Conversely, as partial carbon dioxide pressure and H+ concentrations decrease, CBF declines until it reaches a lower plateau, where additional decreases have minimal effect on CBF. CBV: Cerebral blood volume; CBF: Cerebral blood flow; CPP: Cerebral perfusion pressures; PO2: Partial oxygen; PCO2: Partial carbon dioxide pressure; EEG: Electroencephalography; CPK BB: Brain creatin phosphokinase.
- Citation: Previgliano IJ, Aboumarie HS, Tamagnone FM, Merlo PM, Sosa FA, Feijoo J, Carruega MC. Point of care ultrasound evaluation of cardio-cerebral coupling. World J Crit Care Med 2025; 14(3): 101462
- URL: https://www.wjgnet.com/2220-3141/full/v14/i3/101462.htm
- DOI: https://dx.doi.org/10.5492/wjccm.v14.i3.101462


