Copyright
©The Author(s) 2023.
World J Crit Care Med. Mar 9, 2023; 12(2): 53-62
Published online Mar 9, 2023. doi: 10.5492/wjccm.v12.i2.53
Published online Mar 9, 2023. doi: 10.5492/wjccm.v12.i2.53
Figure 1 Lung ultrasound images.
A: Normal lung showing horizontal artifacts, i.e., A-lines (arrows); B: Vertical artifacts (arrows) known as B-lines indicating interlobular septal thickening, typically seen in congestion; C: Pleural effusion (asterisk) as seen on lateral scan; D: Right pleural effusion (asterisk) as seen from subxiphoid scanning window. IVC: Inferior vena cava.
Figure 2 Venous excess ultrasound grading.
When the diameter of the inferior vena cava is > 2 cm, three grades of congestion are defined based on the severity of abnormalities on hepatic, portal, and renal parenchymal venous Doppler. Hepatic vein Doppler is considered mildly abnormal when the systolic (S) wave is smaller than the diastolic (D) wave, but still below the baseline; it is considered severely abnormal when the S-wave is reversed. Portal vein Doppler is considered mildly abnormal when the pulsatility is 30% to 50%, and severely abnormal when it is ≥ 50%. Asterisks represent points of pulsatility measurement. Renal parenchymal vein Doppler is mildly abnormal when it is pulsatile with distinct S and D components, and severely abnormal when it is monophasic with D-only pattern. Figure adapted from NephroPOCUS.com with permission.
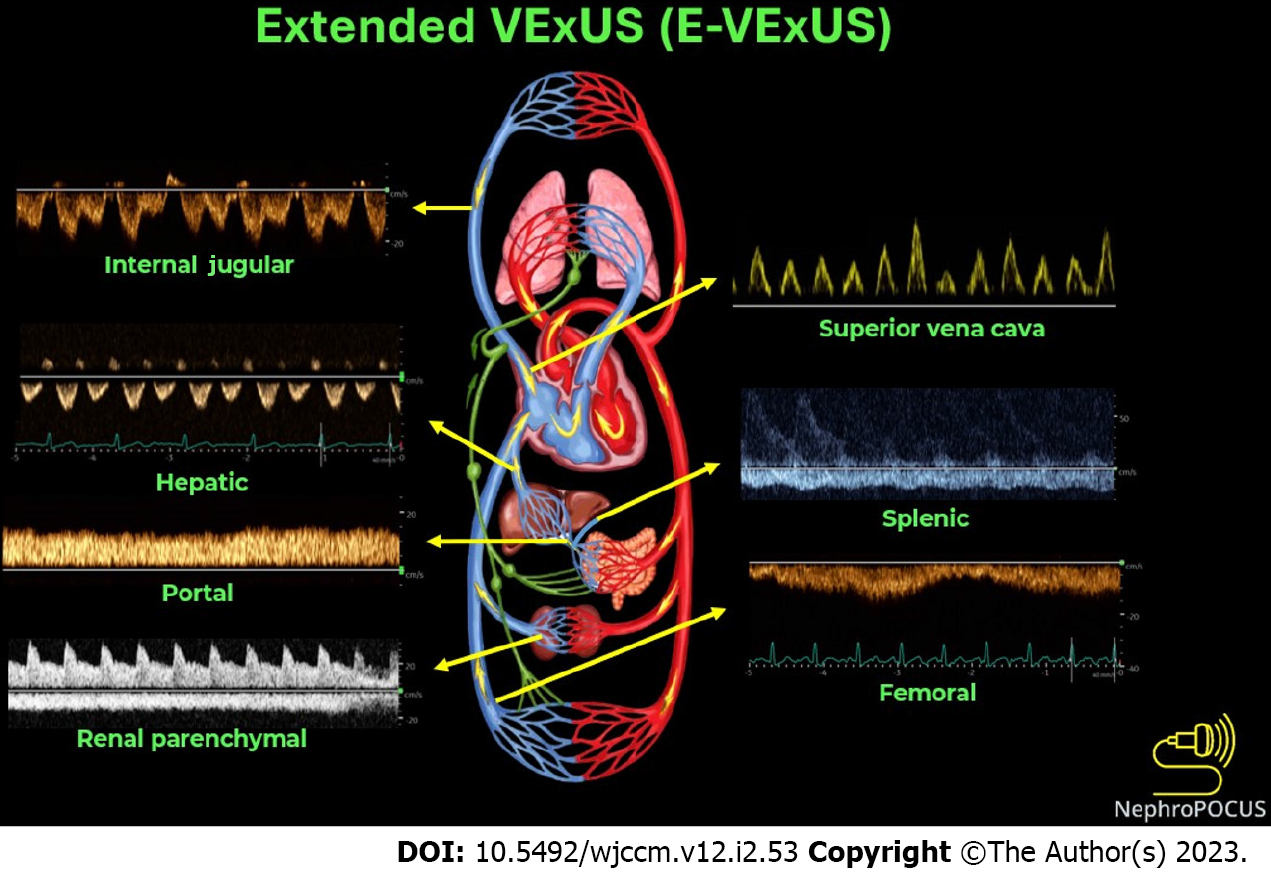
Figure 3 Doppler components of extended venous excess ultrasound score examination.
Figure adapted from NephroPOCUS.com with permission.
Figure 4 The chain of venous congestion: Apical view of the heart is shown in the upper left corner where bulging of the interatrial septum into the left atrium can be noted suggestive of high right atrial pressure.
Next image shows significantly dilated internal jugular vein followed by a plethoric inferior vena cava. Lower panel represents the commonly assessed Doppler parameters to assess systemic venous congestion, all of which are severely abnormal. Please see Figure 3 for the normal appearance of these waveforms and Figure 2 for venous excess ultrasound score grading. RA: Right atrium; RV: Right ventricle; LA: Left atrium; LV: Left ventricle; CA: Carotid artery; S: Systolic wave; D: Diastolic wave.
- Citation: Turk M, Robertson T, Koratala A. Point-of-care ultrasound in diagnosis and management of congestive nephropathy. World J Crit Care Med 2023; 12(2): 53-62
- URL: https://www.wjgnet.com/2220-3141/full/v12/i2/53.htm
- DOI: https://dx.doi.org/10.5492/wjccm.v12.i2.53


