Copyright
©2014 Baishideng Publishing Group Inc.
World J Surg Proced. Jul 28, 2014; 4(2): 33-47
Published online Jul 28, 2014. doi: 10.5412/wjsp.v4.i2.33
Published online Jul 28, 2014. doi: 10.5412/wjsp.v4.i2.33
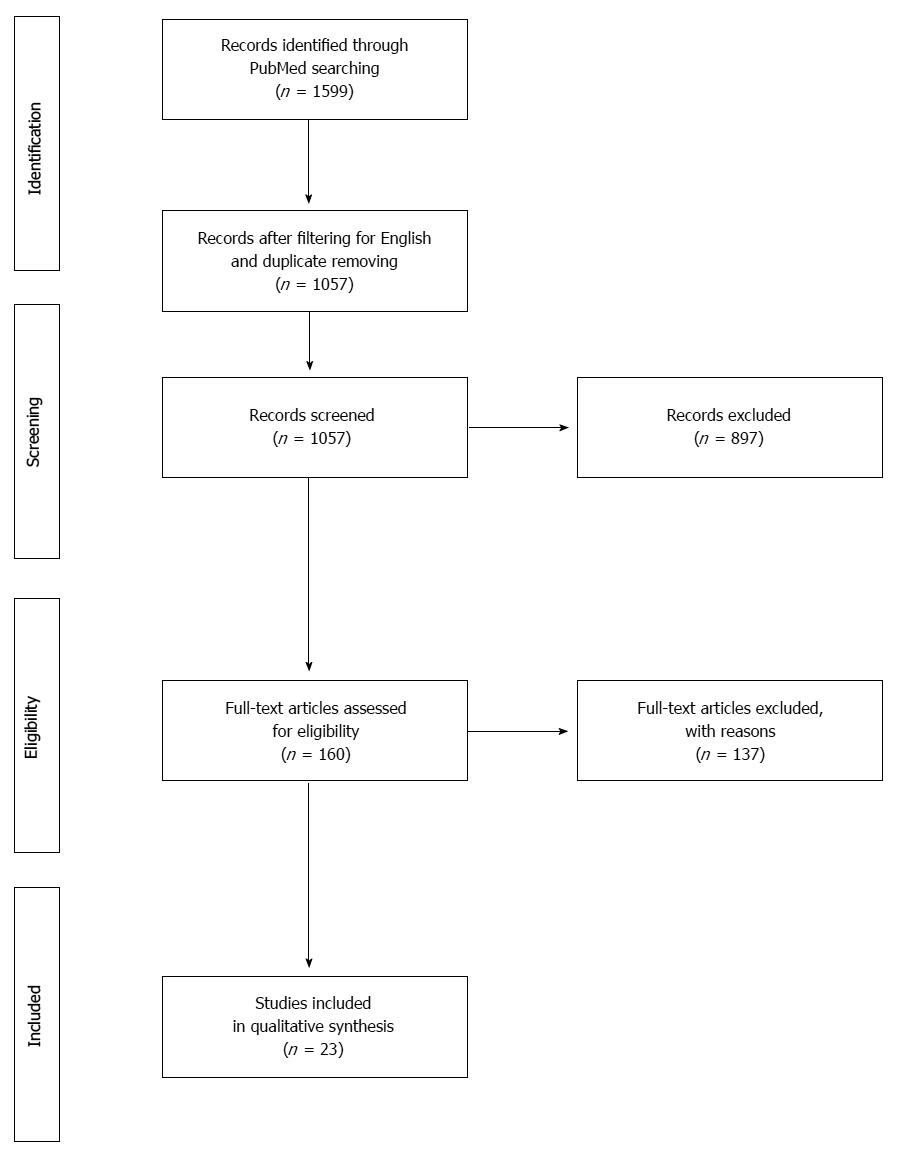
Figure 1 PRISMA flow diagram for the search strategy in PubMed database.
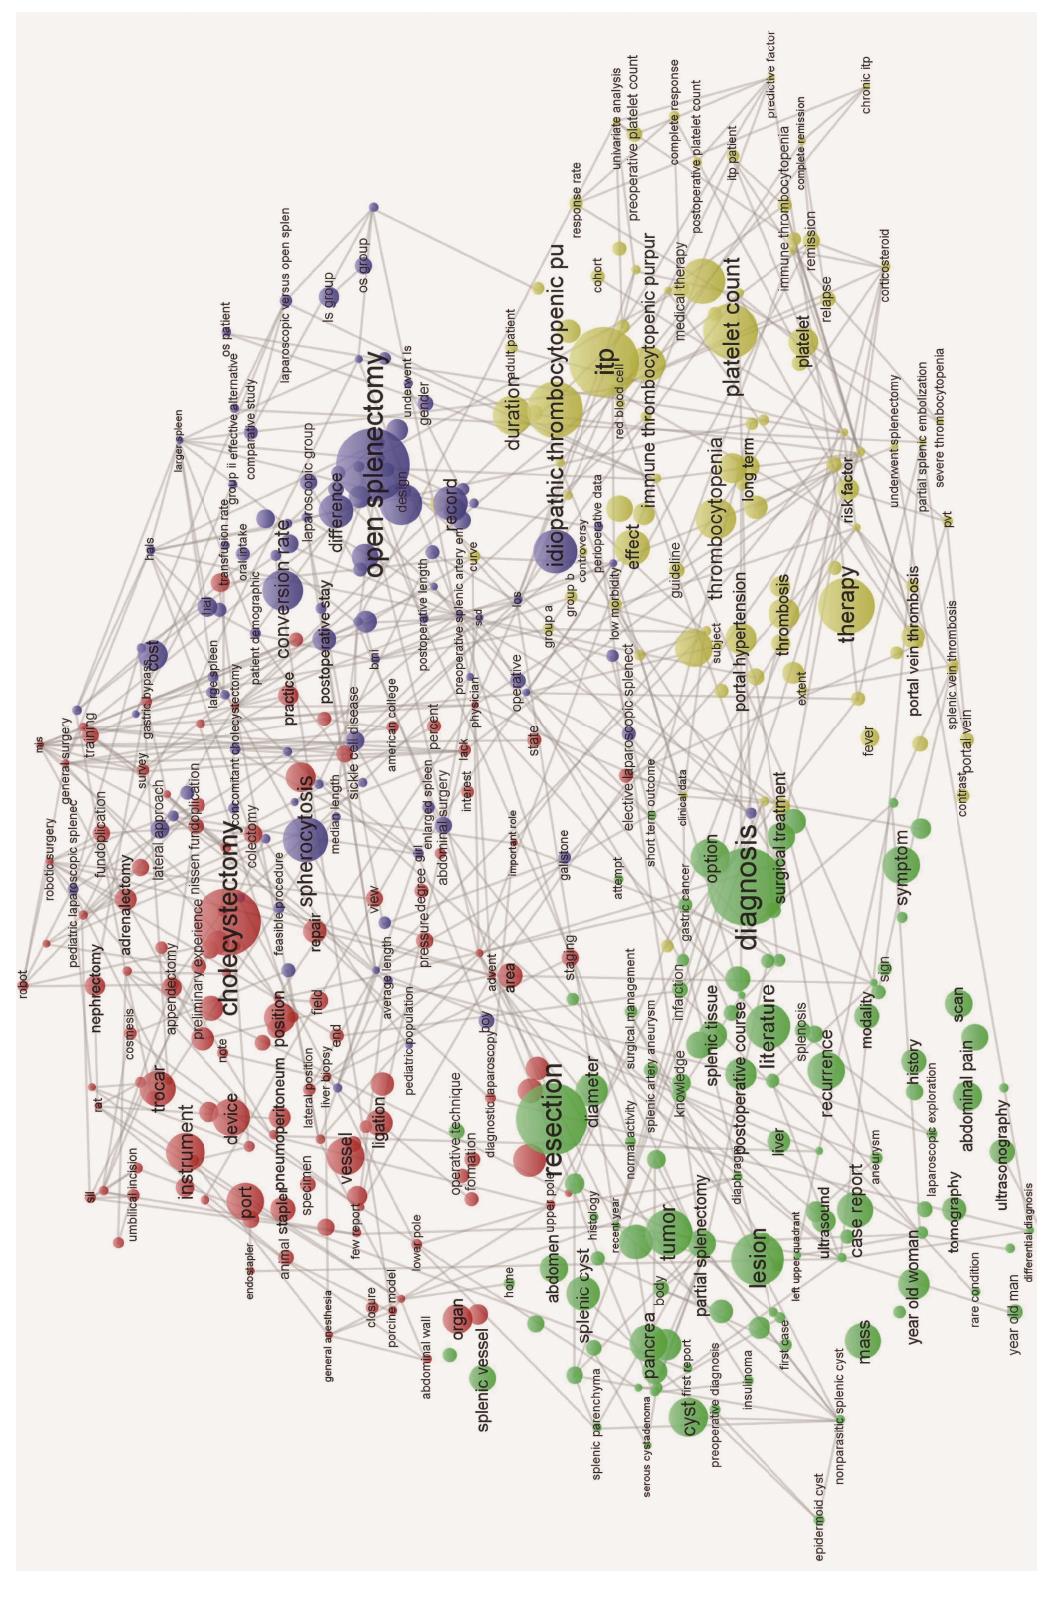
Figure 2 Map of the terms selected (n = 420) from the records included (n = 1141) after searching in web of scienceTM (records published in English during 1991-2013).
The map was built by using the visualization of similarities approach. The terms in the title/abstract text corpus of each record were selected from 18145 terms by assuming the minimum number of term occurrences = 5; only the presence/absence of a term in a record was retained. The colors define the clusters of related items. The size of each circle is related to the number of occurrences.
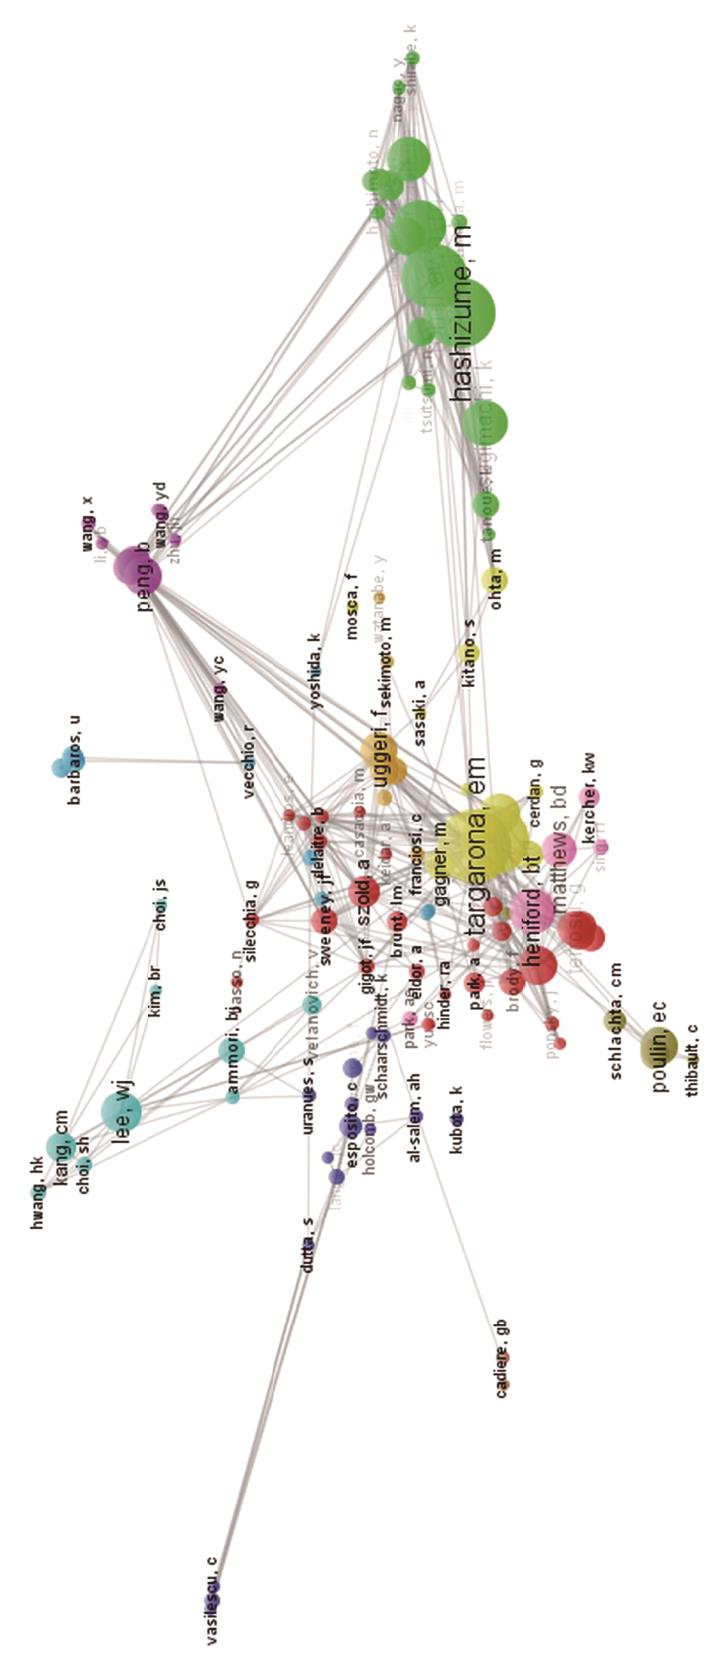
Figure 3 Bibliographic coupling of authors (n = 126) from the records included (n = 1141) after searching in web of scienceTM (records published in English during 1991-2013).
The map was built by using the visualization of similarities approach. The selection was performed from a pool of 5017 authors, assuming the minimum number of records/author = 5. The colors define the clusters of related authors. The size of each circle is related to the number of links.
- Citation: Casaccia M, Stabilini C, Gianetta E, Ibatici A, Santori G. Current concepts of laparoscopic splenectomy in elective patients. World J Surg Proced 2014; 4(2): 33-47
- URL: https://www.wjgnet.com/2219-2832/full/v4/i2/33.htm
- DOI: https://dx.doi.org/10.5412/wjsp.v4.i2.33


