Copyright
©2013 Baishideng Publishing Group Co.
World J Clin Pediatr. Nov 8, 2013; 2(4): 54-64
Published online Nov 8, 2013. doi: 10.5409/wjcp.v2.i4.54
Published online Nov 8, 2013. doi: 10.5409/wjcp.v2.i4.54
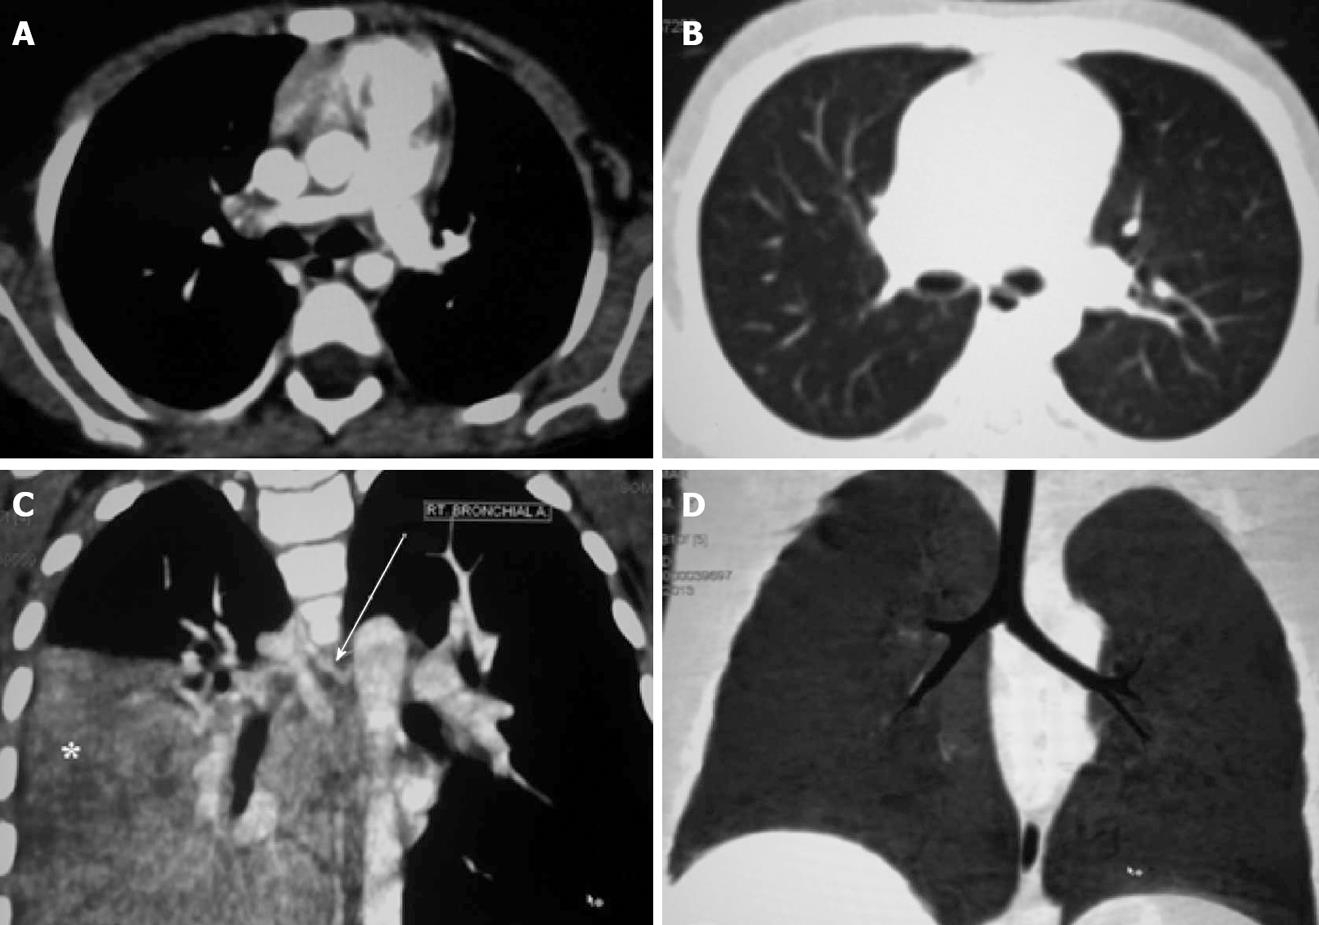
Figure 1 Multi-detector computed tomography image interpretation.
Axial computed tomography image showing mediastinal window (A) and lung window (B). Coronal maximum intensity projection image (C) demonstrating the origin and proximal portion of the right bronchial artery (arrow). There is consolidation in the right lower lobe (asterisk). Coronal Minimum Intensity Projection image (D) delineating the central airways.
- Citation: Singh D, Bhalla AS, Veedu PT, Arora A. Imaging evaluation of hemoptysis in children. World J Clin Pediatr 2013; 2(4): 54-64
- URL: https://www.wjgnet.com/2219-2808/full/v2/i4/54.htm
- DOI: https://dx.doi.org/10.5409/wjcp.v2.i4.54


