
















Copyright: ©Author(s) 2026.
World J Clin Pediatr. Dec 9, 2026; 15(4): 122122
Published online Dec 9, 2026. doi: 10.5409/wjcp.122122
Published online Dec 9, 2026. doi: 10.5409/wjcp.122122
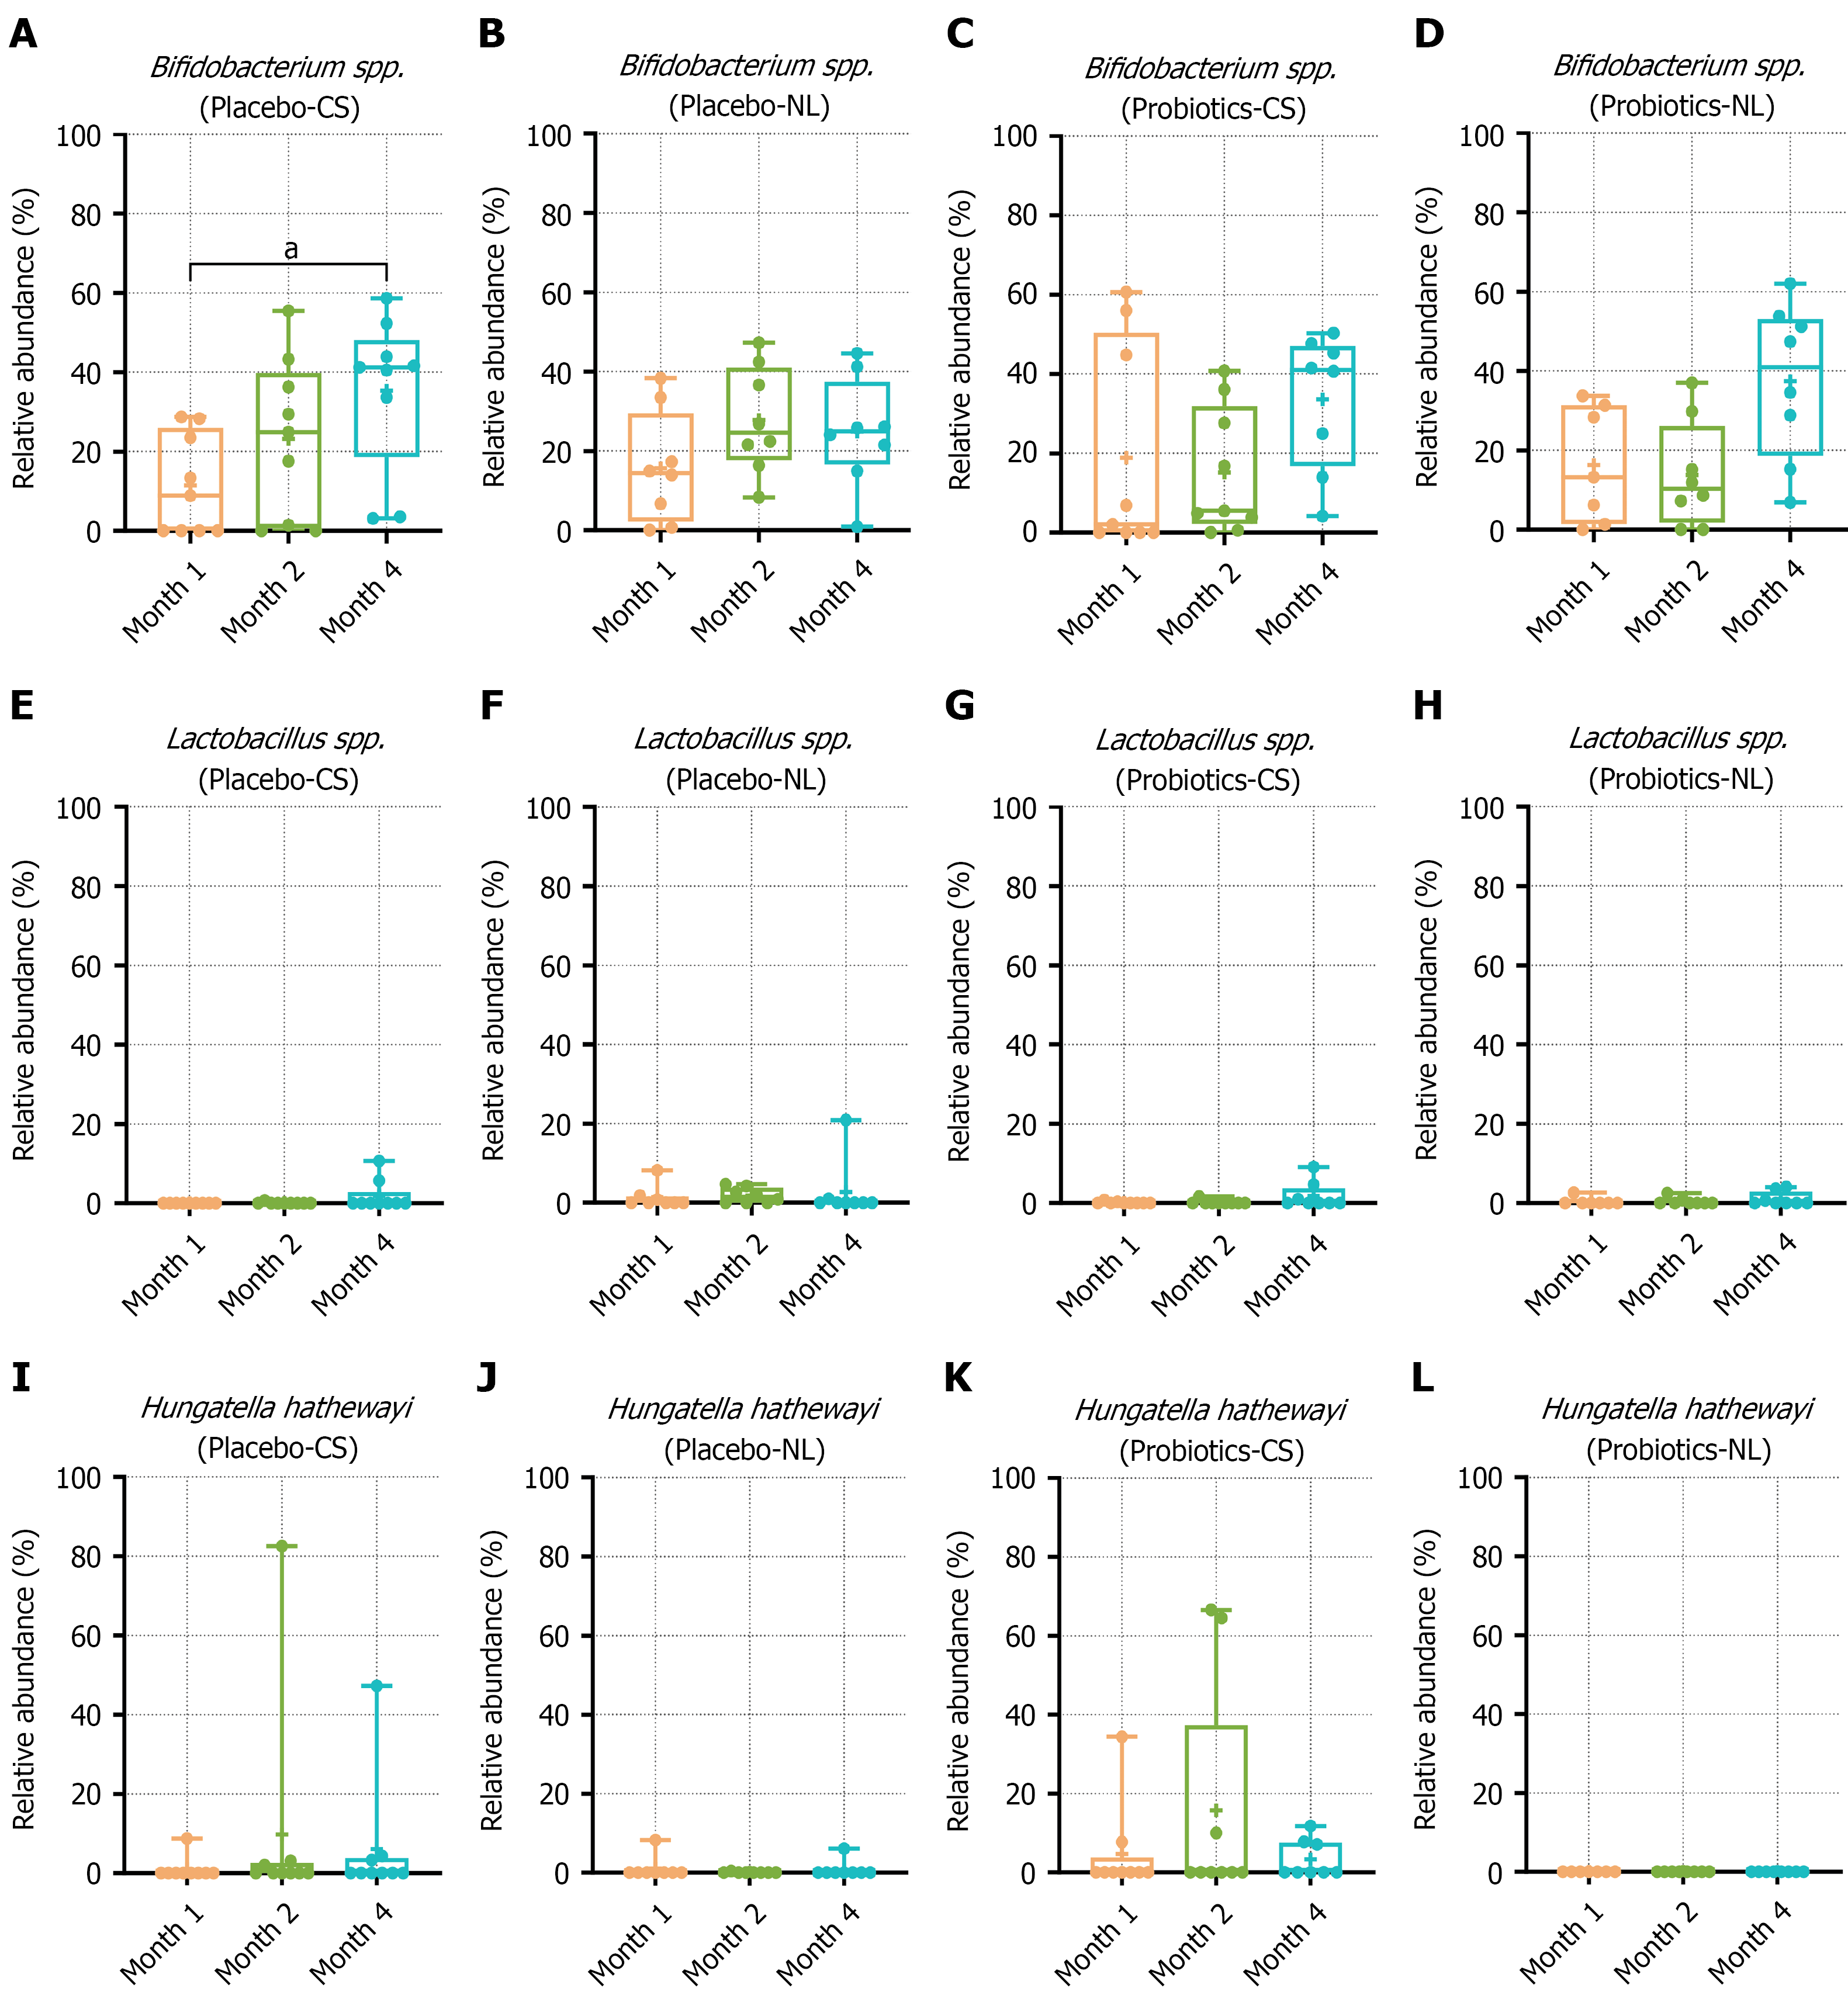
Figure 4 Box-and-whisker plots showing the percentage of relative abundance of bacterium taxa identified by Linear Discriminant Analysis Effect Size analysis in each subgroup placebo-caesarean section, placebo-normal labor, Limosilactobacillus reuteri-caesarean section, and Limosilactobacillus reuteri-normal labor across different time points at 1, 2, 4 months.
A-D: Bifidobacterium spp. in each group; E-H: Lactobacillus spp. in each group; I-L: Hungatella hathewayi in each group. Box-and-whisker plots display the median, the minimum, and the maximum values. NL: Normal labor; CS: Caesarean section.
- Citation: Noicharoen T, Tran DL, Soontornsook A, Visuthranukul C, Thammarakcharoen T, Klomkliew P, Visedthorn S, Phutthawong K, Payungporn S, Sintusek P. Impact of Limosilactobacillus reuteri DSM 17938 on early-life gut microbial diversity. World J Clin Pediatr 2026; 15(4): 122122
- URL: https://www.wjgnet.com/2219-2808/full/v15/i4/122122.htm
- DOI: https://dx.doi.org/10.5409/wjcp.122122