
















Copyright: ©Author(s) 2026.
World J Clin Pediatr. Jun 9, 2026; 15(2): 117841
Published online Jun 9, 2026. doi: 10.5409/wjcp.v15.i2.117841
Published online Jun 9, 2026. doi: 10.5409/wjcp.v15.i2.117841
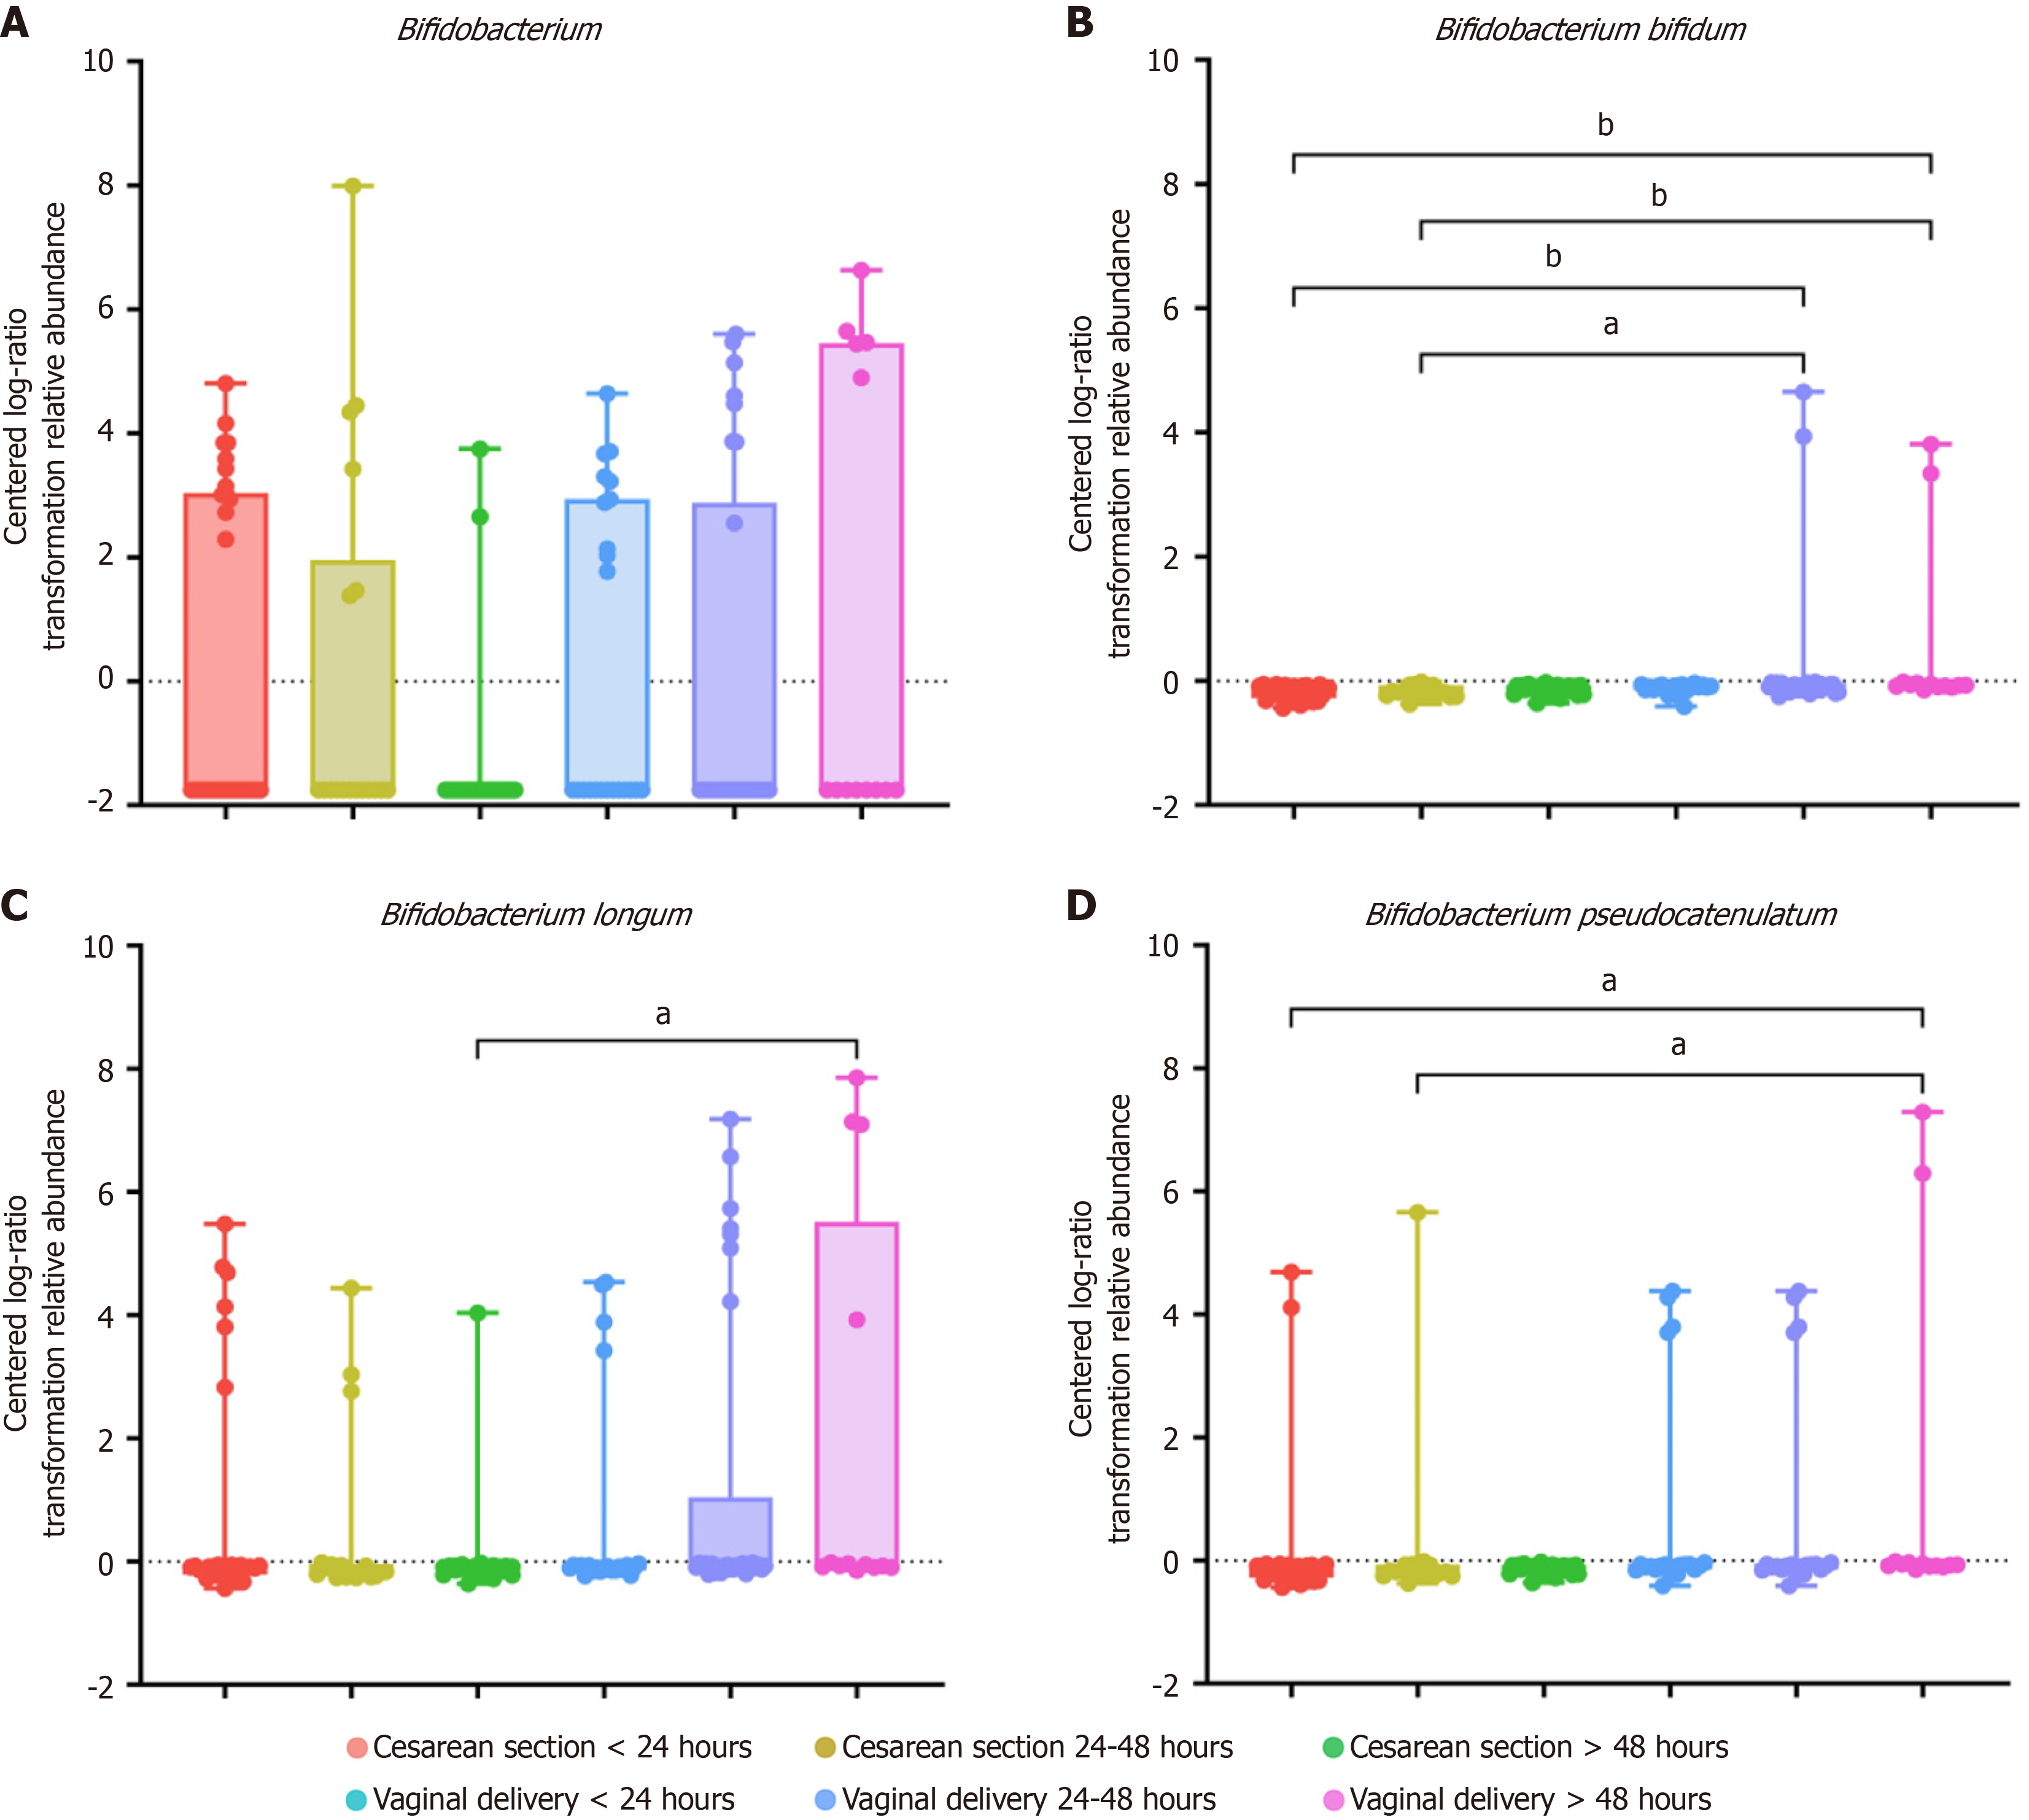
Figure 4 Centered log-ratio transformed relative abundance of Bifidobacterium taxa significantly enriched by linear discriminant analysis effect size analysis.
Box-and-whisker plots show the centered log-ratio-transformed relative abundance of: A: Bifidobacterium (genus); B: Bifidobacterium bifidum; C: Bifidobacterium longum; D: Bifidobacterium pseudocatenulatum across different time points (< 24 hours, 24-48 hours, and > 48 hours). A total of 140 samples were analyzed (cesarean section < 24 hours, n = 31; cesarean section 24-48 hours, n = 18; cesarean section > 48 hours, n = 25; vaginal delivery < 24 hours, n = 23; vaginal delivery 24-48 hours, n = 30; vaginal delivery > 48 hours, n = 13). Boxes represent the median and interquartile range, with whiskers indicating the minimum and maximum values. Statistical differences among time-point groups were evaluated using the Kruskal–Wallis test, followed by Dunn’s post hoc test with multiple-testing correction. Adjusted P values are indicated in the plots, aP < 0.05; bP < 0.01.
- Citation: Sintusek P, Klomkliew P, Visedthorn S, Phutthawong K, Noicharoen T, Soontornsook A, Tran DL, Payungporn S. Distinct early gut microbiota patterns by delivery mode within 100 hours of birth. World J Clin Pediatr 2026; 15(2): 117841
- URL: https://www.wjgnet.com/2219-2808/full/v15/i2/117841.htm
- DOI: https://dx.doi.org/10.5409/wjcp.v15.i2.117841