
















Copyright: ©Author(s) 2026.
World J Clin Pediatr. Jun 9, 2026; 15(2): 115963
Published online Jun 9, 2026. doi: 10.5409/wjcp.v15.i2.115963
Published online Jun 9, 2026. doi: 10.5409/wjcp.v15.i2.115963
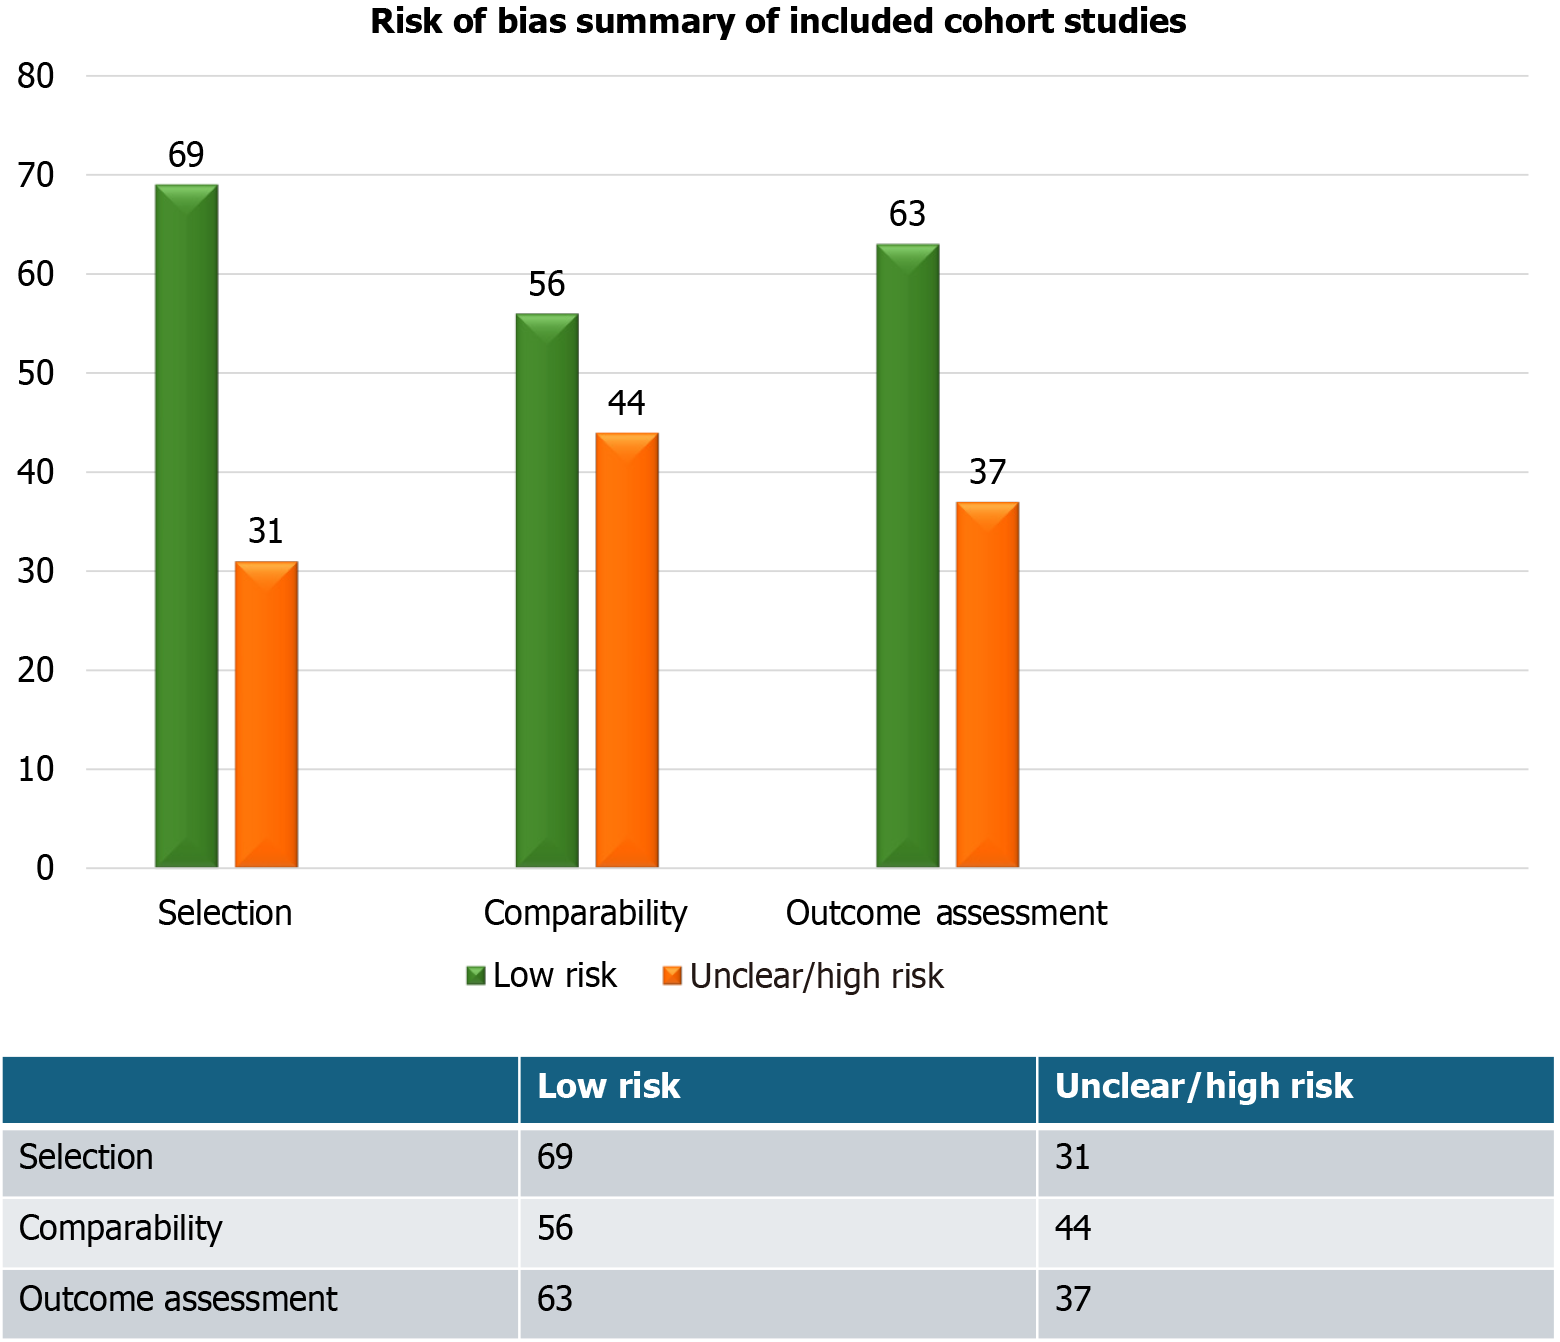
Figure 4 Risk of bias summary of included cohort studies by domain (Newcastle-Ottawa Scale, n = 16).
This figure summarizes the methodological quality of the included non-randomized cohort studies using the Newcastle-Ottawa Scale. The results are categorized across the three core Newcastle-Ottawa Scale domains: Selection, comparability, and outcome. The green bars represent a low risk of bias, yellow/orange represents unclear risk, and red represents high risk for the corresponding domain criteria. The majority of studies showed a low risk of bias in the selection and outcome domains. However, the comparability domain exhibits the highest proportion of unclear or high risk (44% combined). This indicates a significant methodological limitation across the pediatric literature, primarily due to the failure of many studies to adequately report or adjust for critical confounding factors, such as age, body mass index, and pubertal stage. This weak comparability among studies is hypothesized to be a major contributor to the observed statistical heterogeneity (I2) in the meta-analysis results.
- Citation: Elbeltagi RM, Saeed NK, Bediwy AS, Al-Beltagi M. Ultrasound hepatic elastography: A non-invasive indicator of insulin resistance in the pediatric population: A systematic review. World J Clin Pediatr 2026; 15(2): 115963
- URL: https://www.wjgnet.com/2219-2808/full/v15/i2/115963.htm
- DOI: https://dx.doi.org/10.5409/wjcp.v15.i2.115963