
















Copyright: ©Author(s) 2026.
World J Clin Pediatr. Jun 9, 2026; 15(2): 115963
Published online Jun 9, 2026. doi: 10.5409/wjcp.v15.i2.115963
Published online Jun 9, 2026. doi: 10.5409/wjcp.v15.i2.115963
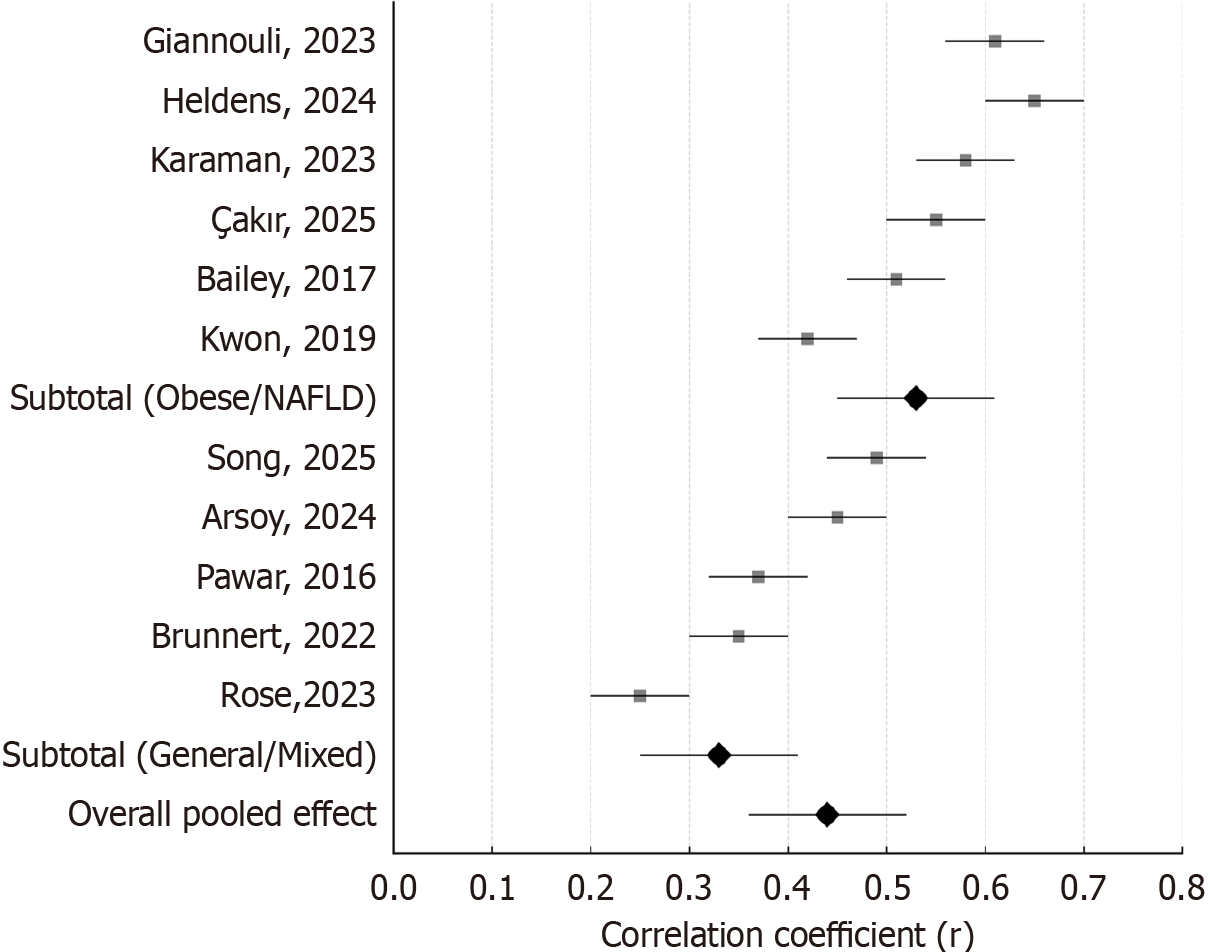
Figure 2 Forest plot of study-level correlations between liver stiffness and insulin resistance in the pediatric population.
The forest plot visually represents the individual study correlations (liver stiffness measurement/shear wave velocity vs insulin resistance) and the overall pooled effect, including the subgroup analysis by patient population. Each line represents an individual study included in the meta-analysis (n = 11, total n = 1338). The pooled overall effect [r = 0.44 (0.39-0.49)] is shown as a gray diamond at the bottom, with horizontal lines indicating 95% confidence intervals under a random-effects model. NAFLD: Non-alcoholic fatty liver disease.
- Citation: Elbeltagi RM, Saeed NK, Bediwy AS, Al-Beltagi M. Ultrasound hepatic elastography: A non-invasive indicator of insulin resistance in the pediatric population: A systematic review. World J Clin Pediatr 2026; 15(2): 115963
- URL: https://www.wjgnet.com/2219-2808/full/v15/i2/115963.htm
- DOI: https://dx.doi.org/10.5409/wjcp.v15.i2.115963