
















©The Author(s) 2025.
World J Clin Pediatr. Dec 9, 2025; 14(4): 111641
Published online Dec 9, 2025. doi: 10.5409/wjcp.v14.i4.111641
Published online Dec 9, 2025. doi: 10.5409/wjcp.v14.i4.111641
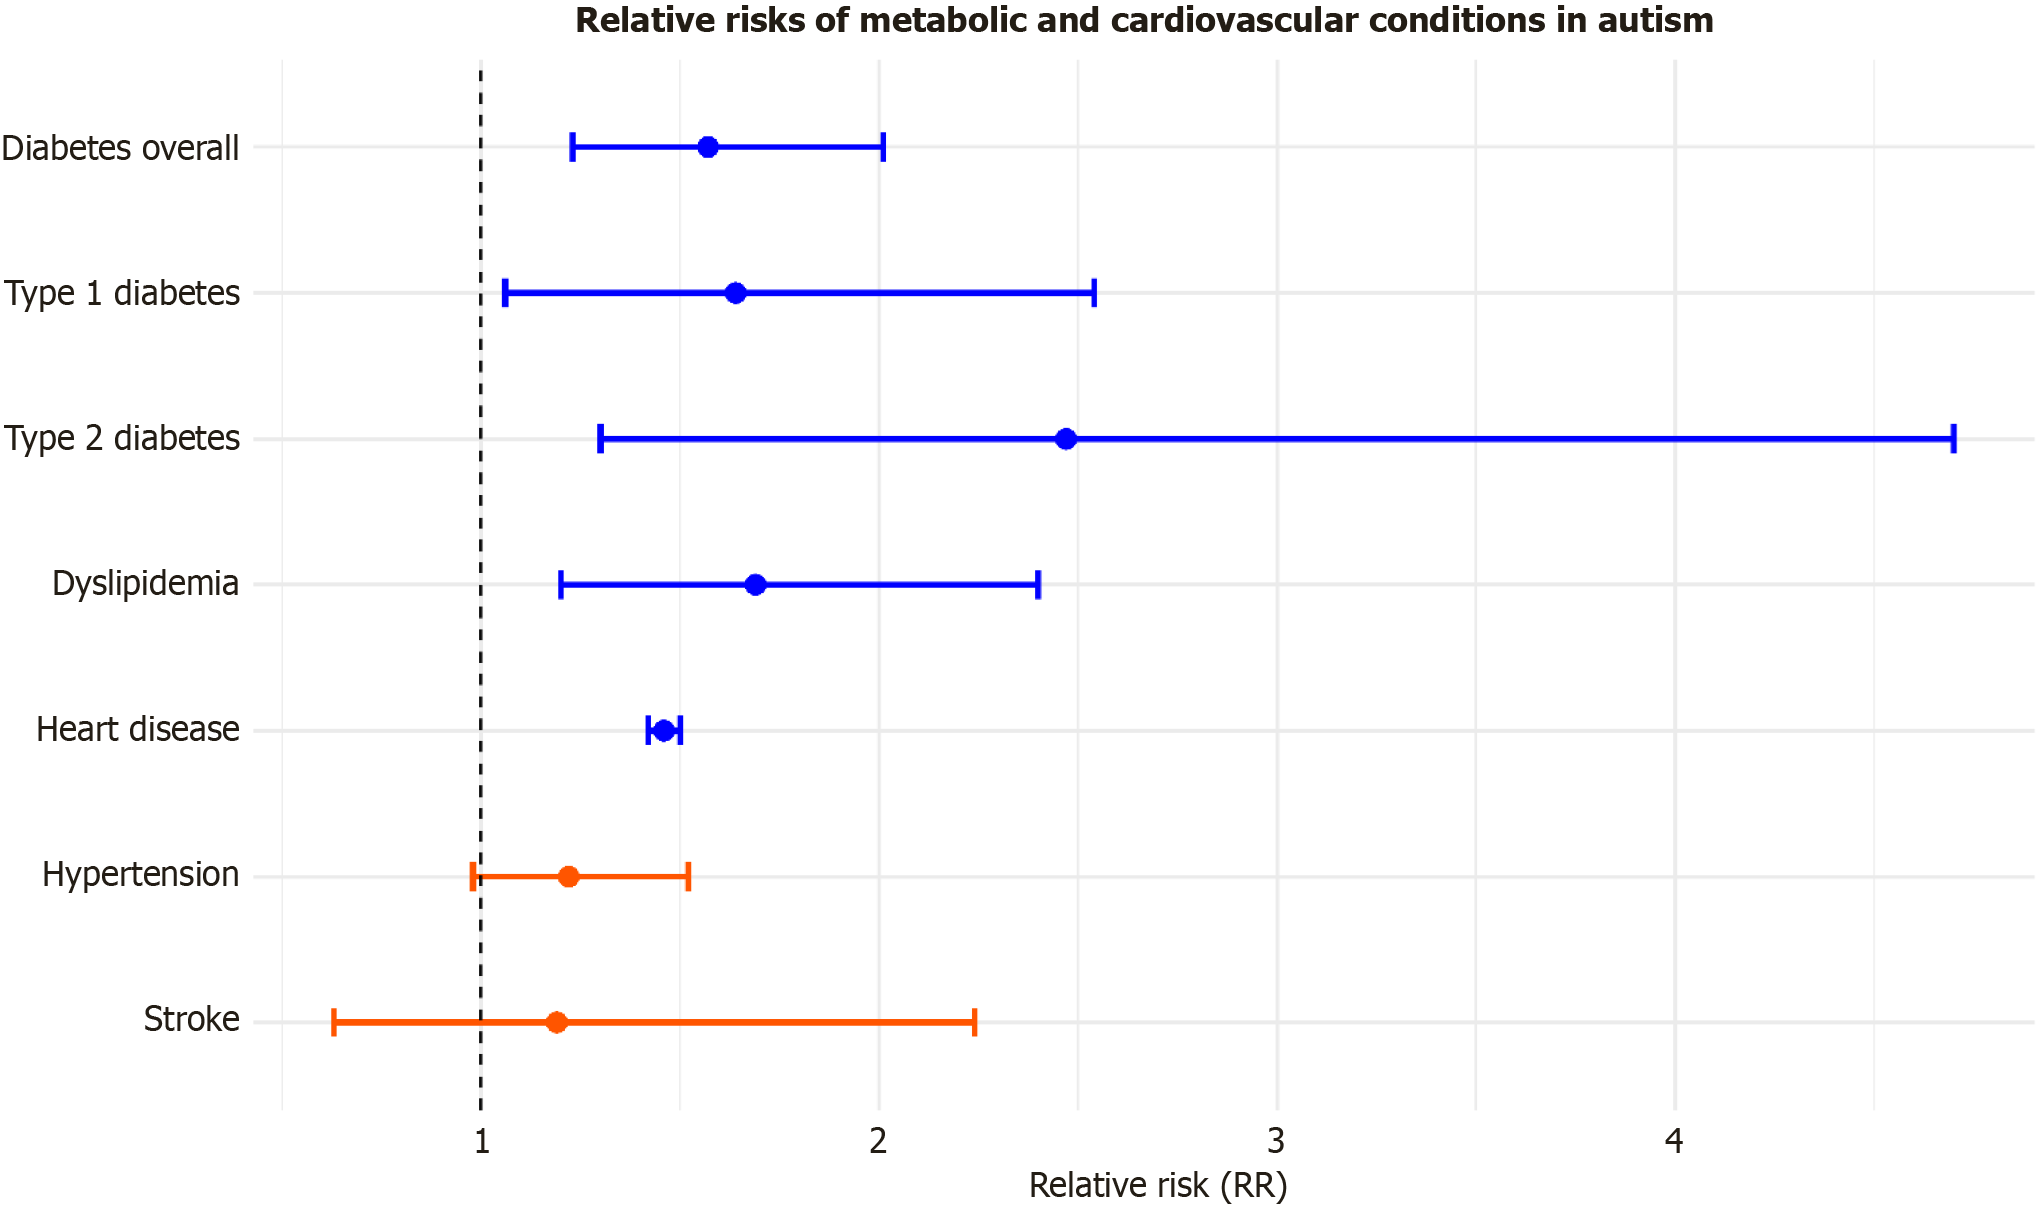
Figure 4 Forest plot of relative risks and 95%CIs for metabolic and cardiovascular conditions among autistic patients compared to neurotypical controls.
The plot presents pooled relative risk (RRs) from meta-analyses across multiple studies for various conditions: Diabetes overall, type 1 diabetes, type 2 diabetes, dyslipidemia, heart disease, hypertension, and stroke. Blue points indicate significant associations (P < 0.05), where the 95%CI does not cross the line of no effect (RR = 1), suggesting a higher risk of the condition in autistic individuals compared to controls. Red points represent non-significant results (P ≥ 0.05), where the 95%CI crosses the RR = 1 line, indicating no statistically significant difference in risk between autism and controls. The vertical dashed line at RR = 1 serves as a reference, representing no increased or decreased risk. Conditions such as type 2 diabetes and dyslipidemia show a notably higher risk in autism, while the risk differences for hypertension and stroke are not statistically significant.
- Citation: Hasan H, Hagerman R, Say DS, Nguyen AP, Babata K, Oyegbile-Chidi T, Herrera-Guerra A, Torrents C, Silver CE, Restrepo B. Parallel paths: A narrative review exploring autism and its co-occurring conditions. World J Clin Pediatr 2025; 14(4): 111641
- URL: https://www.wjgnet.com/2219-2808/full/v14/i4/111641.htm
- DOI: https://dx.doi.org/10.5409/wjcp.v14.i4.111641