
















©The Author(s) 2025.
World J Clin Pediatr. Dec 9, 2025; 14(4): 110776
Published online Dec 9, 2025. doi: 10.5409/wjcp.v14.i4.110776
Published online Dec 9, 2025. doi: 10.5409/wjcp.v14.i4.110776
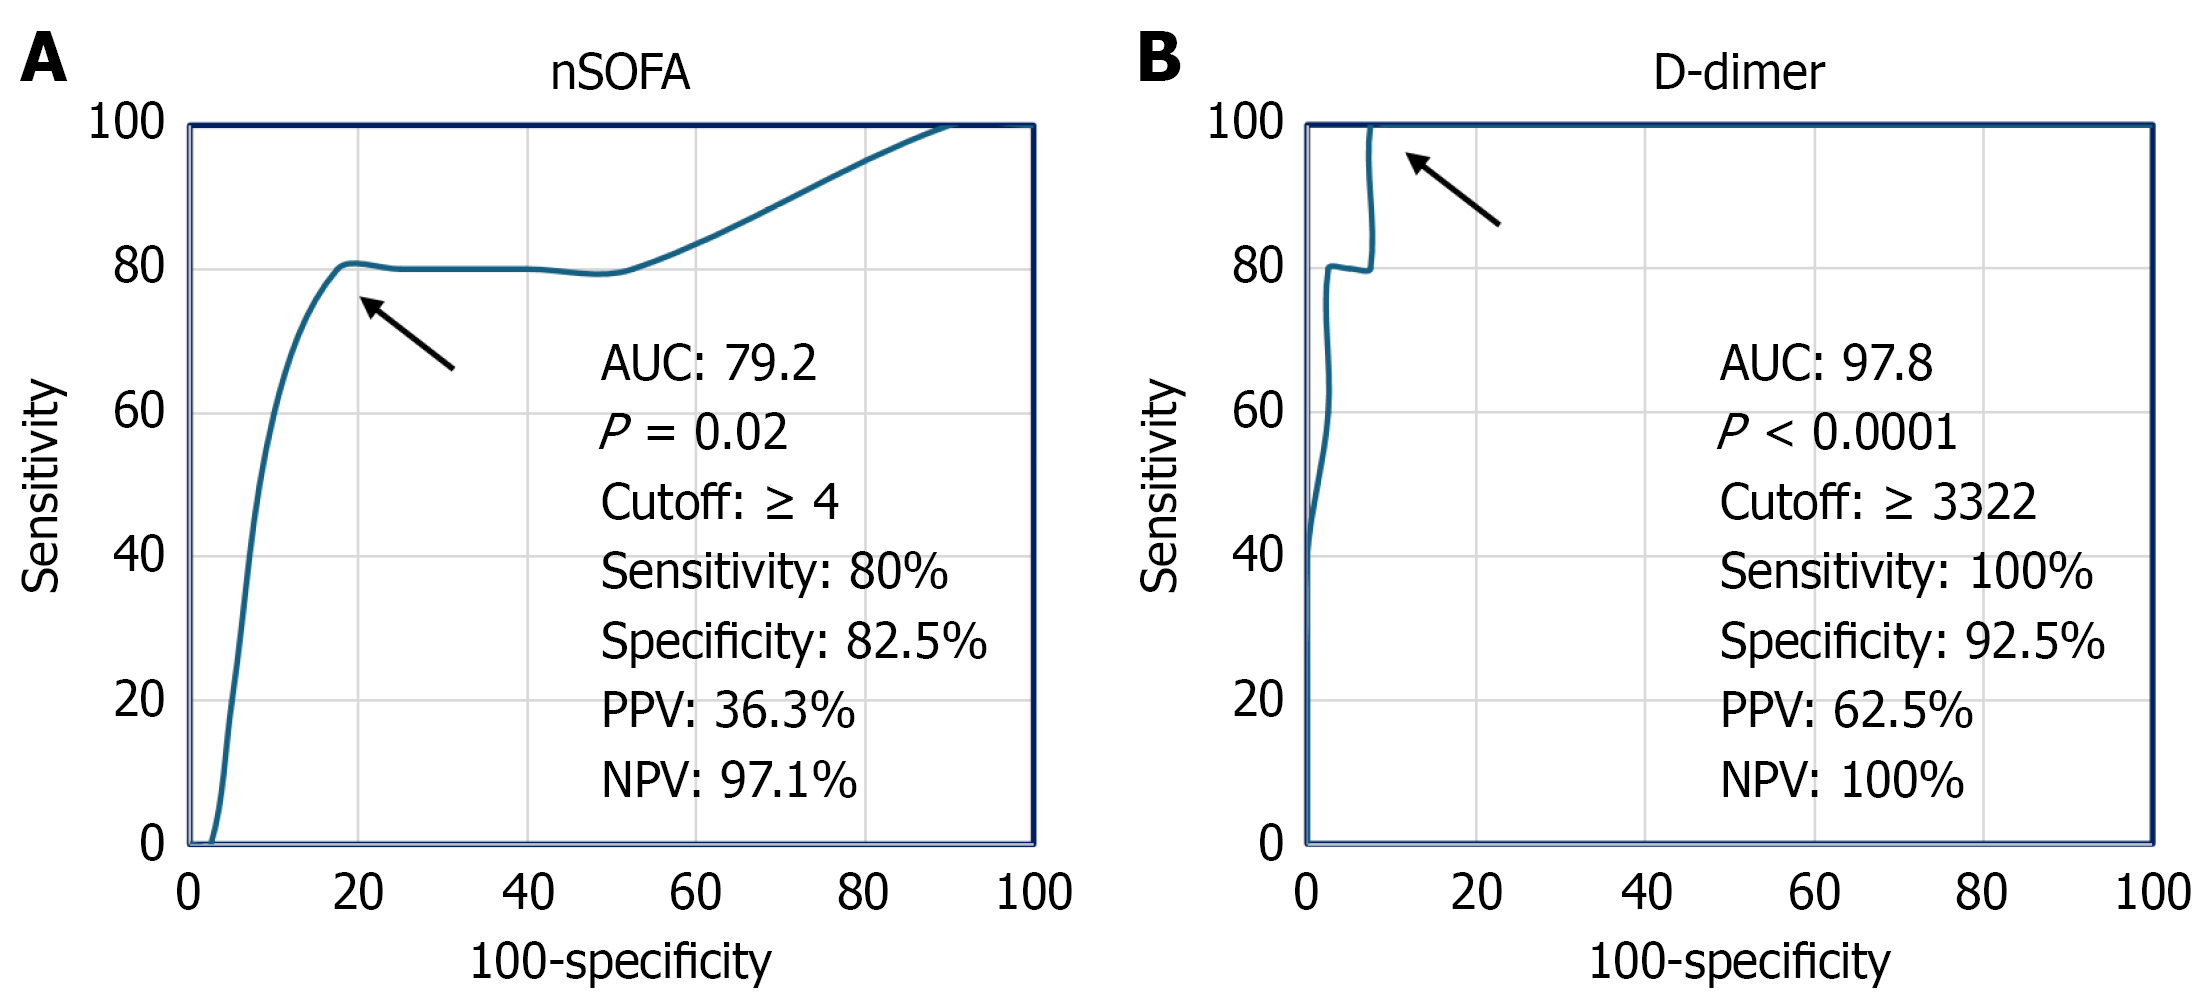
Figure 3 Performance of mortality predictors.
A: D-dimer; B: Neonatal sequential organ failure assessment. Sensitivity is plotted on Y axis and specificity on X axis. Performance percentages are in the lower right box. Selection of cutoff values is based on the best performance (highest sensitivity and specificity simu
- Citation: Basiouny HEM, Allam SS, Allam AA, Abdelsattar S, Sira MM. Diagnostic and prognostic utility of D-dimer and heparin-binding protein in neonatal sepsis: A prospective case-control study. World J Clin Pediatr 2025; 14(4): 110776
- URL: https://www.wjgnet.com/2219-2808/full/v14/i4/110776.htm
- DOI: https://dx.doi.org/10.5409/wjcp.v14.i4.110776