Copyright
©2014 Baishideng Publishing Group Inc.
World J Respirol. Nov 28, 2014; 4(3): 19-25
Published online Nov 28, 2014. doi: 10.5320/wjr.v4.i3.19
Published online Nov 28, 2014. doi: 10.5320/wjr.v4.i3.19
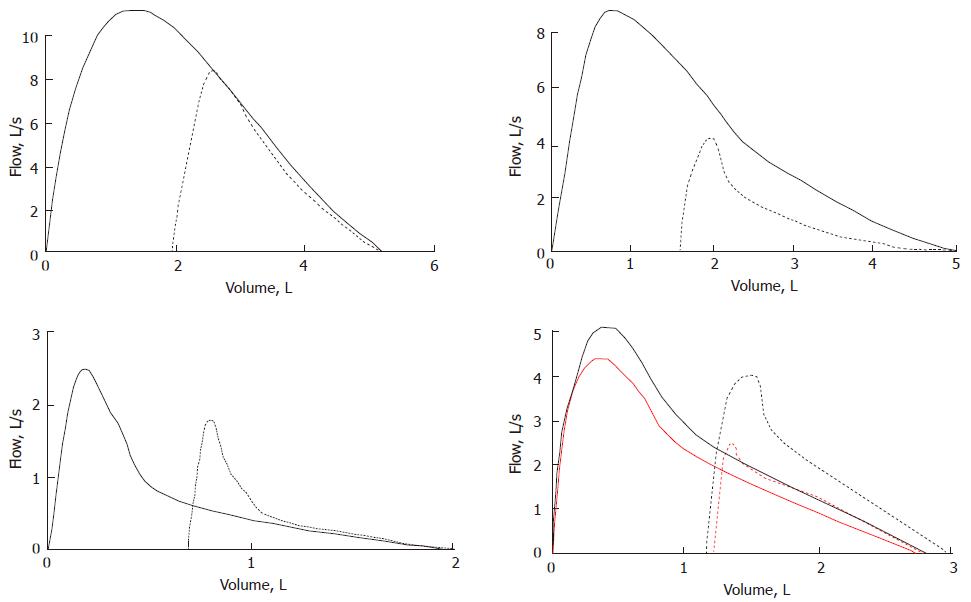
Figure 3 Examples of the effects of the deep breath on maximum flow and volume depending on the disease condition.
Continuous and dashed lines are maximal and partial flow-volume loops, respectively. Upper left panel is a normal case. The slight increase in flow after DB suggests a decrease of normal bronchial tone presumably provided by the vagus nerve. Upper right panel is the case of a mild asthmatic subjects during a bronchial challenge. The increase in flow after the deep breath indicates that a substantial part of the constrictor response to the chemical agent is ablated with DB. Lower left panel is the case of a patient affected by chronic obstructive lung disease in which taking a DB is associated with a decrease of flow. This is presumably due to the involvement of the peripheral lung regions that contribute to the lung elastic recoil and/or loss of airway-to-parenchyma interdependence. Lower right lung is the case of an asthmatic subject before and after (red and balck lines, respectively) inhaling a bronchodilator agent. Isovolume flow measured during manoeuvres initiated from mid lung volumes (dashed lines) is higher than flow after a maximum lung inflation (continuous lines).
- Citation: Antonelli A, Pellegrino GM, Sferrazza Papa GF, Pellegrino R. Pitfalls in spirometry: Clinical relevance. World J Respirol 2014; 4(3): 19-25
- URL: https://www.wjgnet.com/2218-6255/full/v4/i3/19.htm
- DOI: https://dx.doi.org/10.5320/wjr.v4.i3.19


