Copyright
©2013 Baishideng Publishing Group Co.
World J Hematol. Nov 6, 2013; 2(4): 115-118
Published online Nov 6, 2013. doi: 10.5315/wjh.v2.i4.115
Published online Nov 6, 2013. doi: 10.5315/wjh.v2.i4.115
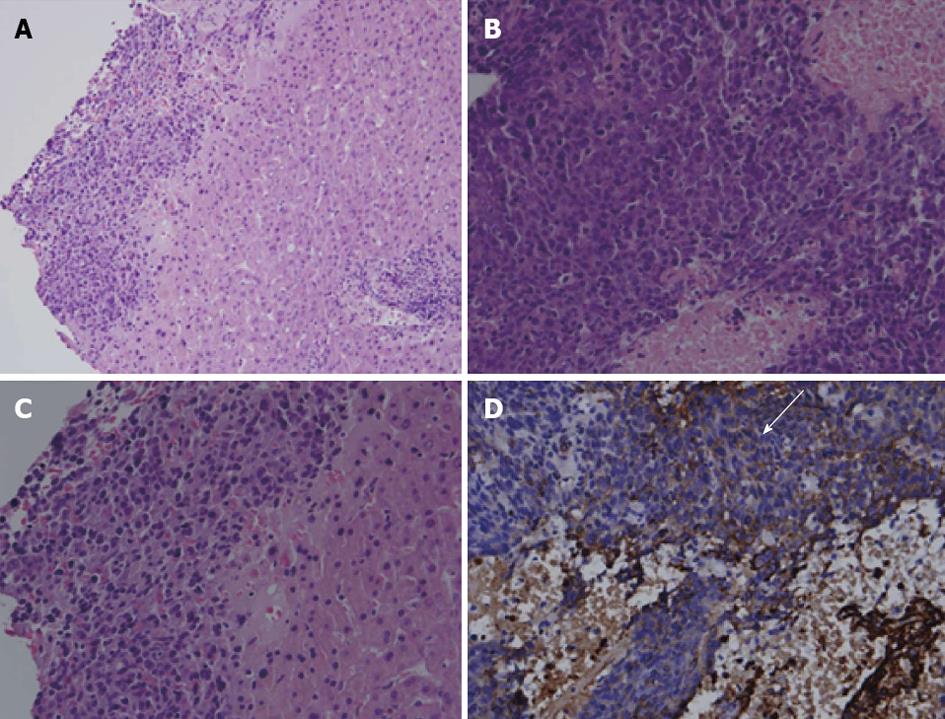
Figure 2 Liver aspiration.
A: Liver tissue with tumor arranged in solid sheet on the left side of the picture (HE stain, x 200); B: High power view shows tumor cells with hyperchromatic nuclei and high nucleus-to-cytoplasm (N/C) ratio (HE stain, x 400). Two patches of necrosis are found in the lower and right upper part; C: Tumor cells in solid nest with hyperchromatic nuclei and high N/C ratio. The right side is normal liver tissue (HE stain, x 400); D: AE1/AE3 (IHC stain, x 400). Focal cytoplasmic positive reaction (white arrow).
- Citation: Yang CC, Chow WK, Peng YC, Wang RC. Gemcitabine cures metastatic hepatic carcinoma and bone metastasis. World J Hematol 2013; 2(4): 115-118
- URL: https://www.wjgnet.com/2218-6204/full/v2/i4/115.htm
- DOI: https://dx.doi.org/10.5315/wjh.v2.i4.115


