
















©The Author(s) 2026.
World J Hematol. Jan 21, 2026; 12(1): 115355
Published online Jan 21, 2026. doi: 10.5315/wjh.v12.i1.115355
Published online Jan 21, 2026. doi: 10.5315/wjh.v12.i1.115355
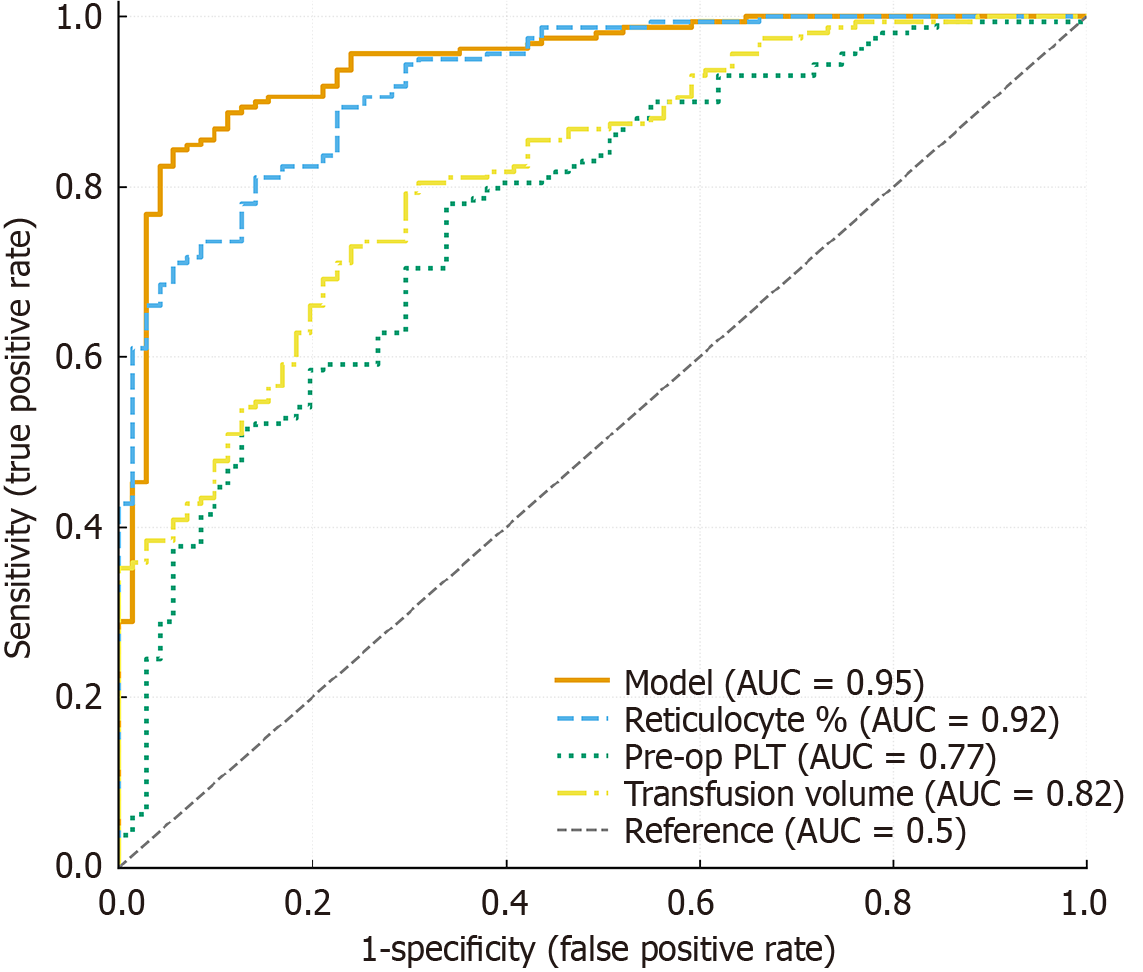
Figure 1 Receiver operating characteristic curves comparing the nomogram and single predictors.
Receiver operating characteristic analysis comparing the predictive performance of the nomogram model with individual predictors for postoperative thrombocytosis. The nomogram achieved the highest discriminative ability [area under the curve (AUC) = 0.92, 95% confidence interval (CI): 0.87-0.96], outperforming all single parameters. Among single factors, the reticulocyte percentage (AUC = 0.79) showed moderate predictive power, followed by preoperative platelet count (AUC = 0.76), transfusion volume (AUC = 0.78), and mean platelet volume (AUC = 0.73). The diagonal dashed line represents the reference line of no discrimination (AUC = 0.5). AUC: Area under the curve; PLT: Platelet.
- Citation: Zhang T, Li ZC, Pan ZB, Qi SQ, Tang R. Nomogram-based prediction of post-splenectomy thrombocytosis in children with hereditary spherocytosis. World J Hematol 2026; 12(1): 115355
- URL: https://www.wjgnet.com/2218-6204/full/v12/i1/115355.htm
- DOI: https://dx.doi.org/10.5315/wjh.v12.i1.115355