Copyright
©2013 Baishideng.
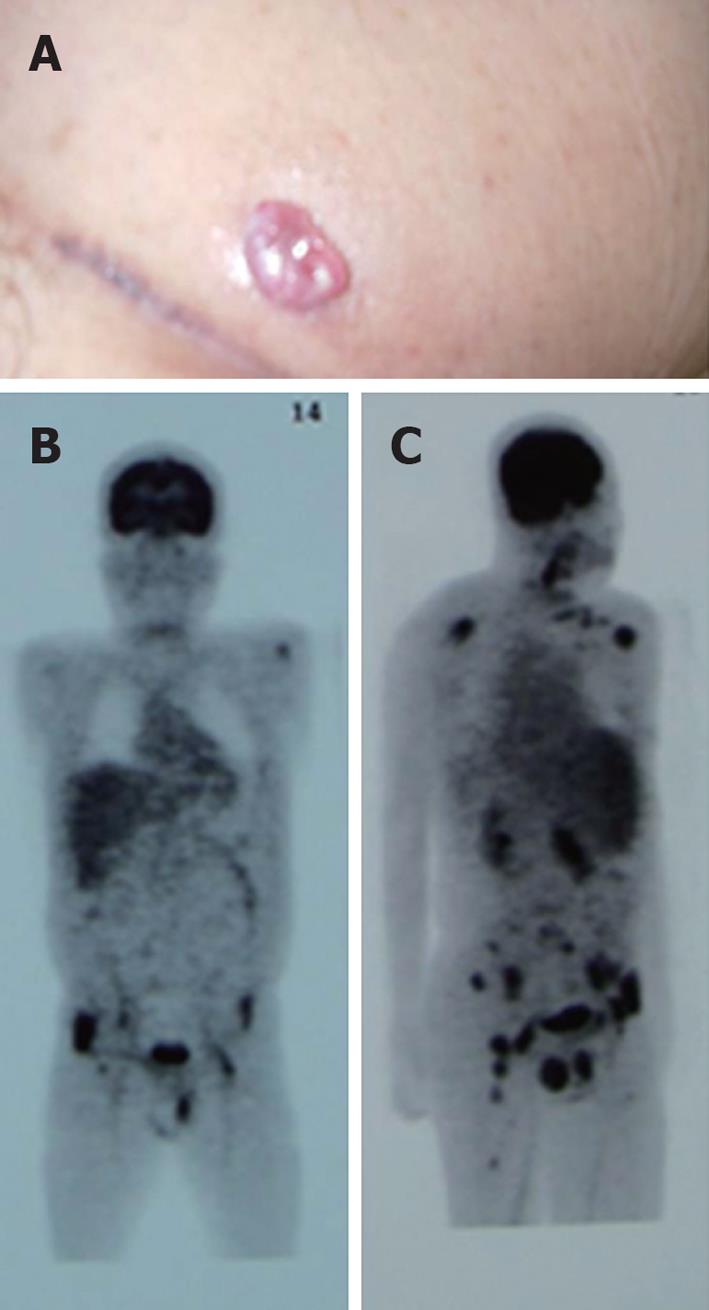
Figure 1 Langerhans cell histiocytosis skin lesions and systemic positron emission tomography imaging.
A: Soft papular skin lesion is found at the inguinal area. Biopsy of the lesion revealed the histology of langerhans cell histiocytosis; B, C: Positron emission tomography scan shows multiple lesions, at the scapulas, plevic bones, cervical and inguinal lymph nodes: frontal view (B), lateral view (C).
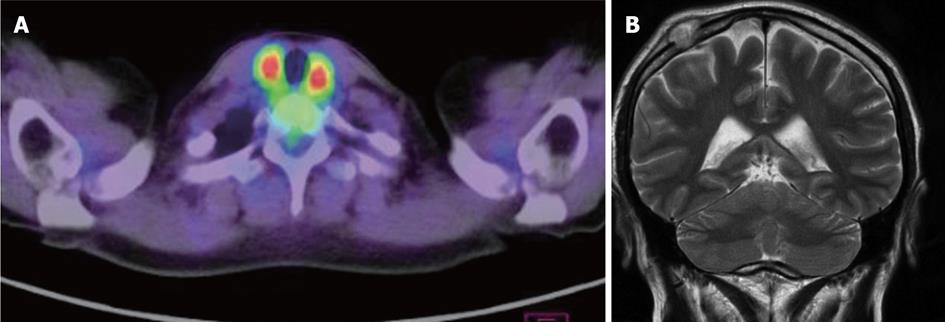
Figure 2 langerhans cell histiocytosis thyroid (A) and skull (B) lesions.
A: Positron emission tomography scan shows hot spots (SUVmax = 7.0) at both lobes of thyroid; B: Magnetic resonance imaging (T2W2) shows a mass at the right parietal region.
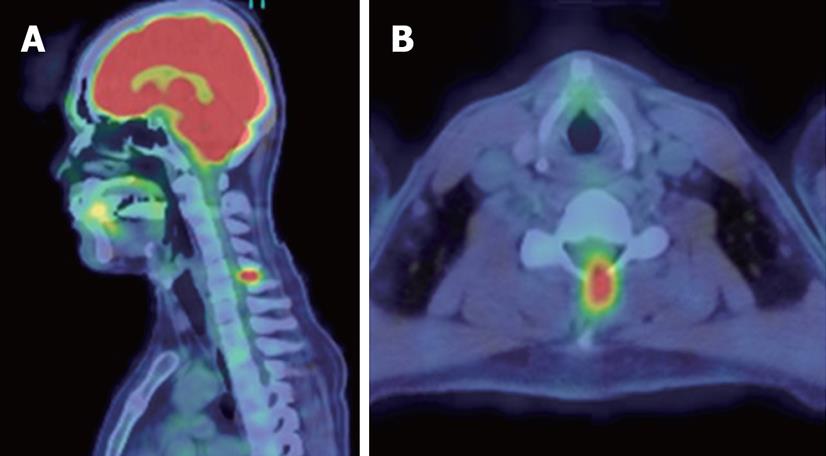
Figure 3 langerhans cell histiocytosis bone lesion at cervical vertebra 6.
Positron emission tomography scan shows a hot spot (SUVmax = 6.6) at the spinous process of C6. A: Sagittal view; B: Axial view.
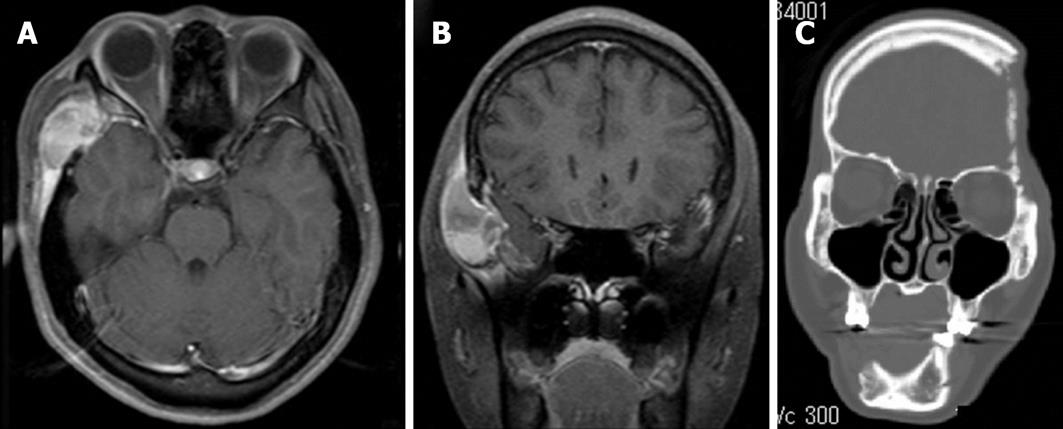
Figure 4 Langerhans cell histiocytosis skull mass (A, B) and lytic skull (C) lesion.
A, B: Gadolinium-enhanced magnetic resonance imaging (T1W1) shows a mass with heterodensity at the right temporal area. axial view (A), coronal view (B); C: Computed tomography scan shows extensive lytic bones, at the left temporal bone and mandible. Defect of the right mandible is due to surgical resection.
Figure 5 Langerhans cell histiocytosis mass at the hypothalamic area (A) and hypothalamic–pituitary area, comparison of pre and post chemotherapy (B, C).
A: Gadolinium-enhanced magnetic resonance imaging (W1T1) shows a large mass at the hypothalamic area. Pituitary stalk is enlarged; B, C: Gadolinium-enhanced magnetic resonance imaging (T1W1) shows (B) a large mass before chemotherapy and (C) a residual mass post chemotherapy. The size of mass was significantly reduced after 2-deoxychloroadenosine treatment.
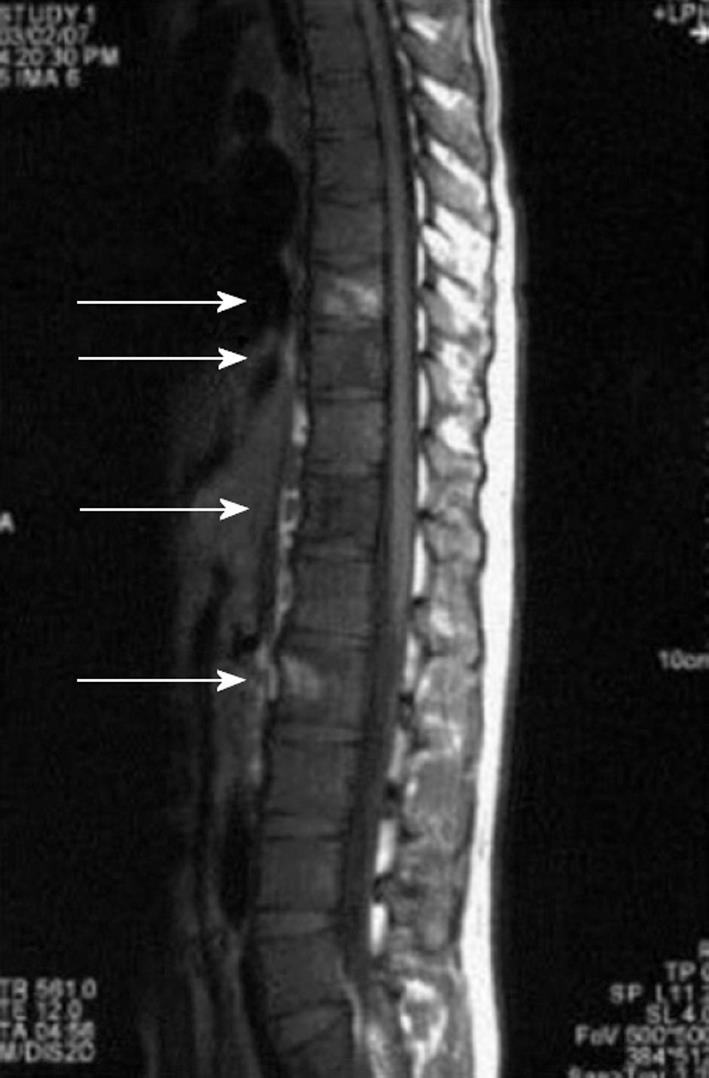
Figure 6 Langerhans cell histiocytosis spinal lesions.
Non-enhanced magnetic resonance imaging (T1W1) shows high and low signals at multiple vertebral bodies (arrows).
- Citation: Imashuku S, Shimazaki C, Tojo A, Imamura T, Morimoto A. Management of adult Langerhans cell histiocytosis based on the characteristic clinical features. World J Hematol 2013; 2(3): 89-98
- URL: https://www.wjgnet.com/2218-6204/full/v2/i3/89.htm
- DOI: https://dx.doi.org/10.5315/wjh.v2.i3.89


