Copyright
©The Author(s) 2017.
World J Orthop. Dec 18, 2017; 8(12): 913-921
Published online Dec 18, 2017. doi: 10.5312/wjo.v8.i12.913
Published online Dec 18, 2017. doi: 10.5312/wjo.v8.i12.913
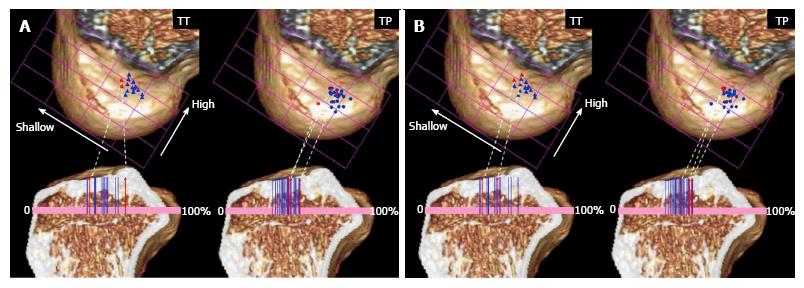
Figure 4 Tunnel positions in trans-tibial and trans-portal group are plotted for the femur and the tibia.
A: Blue and red markers mean the side-to-side differences of Kneelax3 arthrometer of the case were under 3 mm (blue) and over 3 mm (red), respectively; B: Blue and red markers mean the side-to-side differences of anterolateral tibial translation were under 3 mm (blue) and over 3 mm (red), respectively. TT: Trans-tibial; TP: Trans-portal.
- Citation: Tashiro Y, Okazaki K, Murakami K, Matsubara H, Osaki K, Iwamoto Y, Nakashima Y. Anterolateral rotatory instability in vivo correlates tunnel position after anterior cruciate ligament reconstruction using bone-patellar tendon-bone graft. World J Orthop 2017; 8(12): 913-921
- URL: https://www.wjgnet.com/2218-5836/full/v8/i12/913.htm
- DOI: https://dx.doi.org/10.5312/wjo.v8.i12.913


