Copyright
©The Author(s) 2016.
World J Orthop. Aug 18, 2016; 7(8): 467-474
Published online Aug 18, 2016. doi: 10.5312/wjo.v7.i8.467
Published online Aug 18, 2016. doi: 10.5312/wjo.v7.i8.467
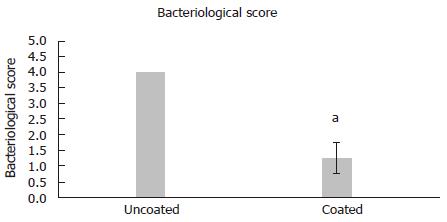
Figure 2 Graphical representation of bacteriological scores from surrounding tissue on a 0-4 point scale.
Data is represented as mean ± SD. Statistically significant difference between groups was determined by Mann-Whitney Rank Sum test (aP < 0.05).
- Citation: Jennings JA, Beenken KE, Skinner RA, Meeker DG, Smeltzer MS, Haggard WO, Troxel KS. Antibiotic-loaded phosphatidylcholine inhibits staphylococcal bone infection. World J Orthop 2016; 7(8): 467-474
- URL: https://www.wjgnet.com/2218-5836/full/v7/i8/467.htm
- DOI: https://dx.doi.org/10.5312/wjo.v7.i8.467


